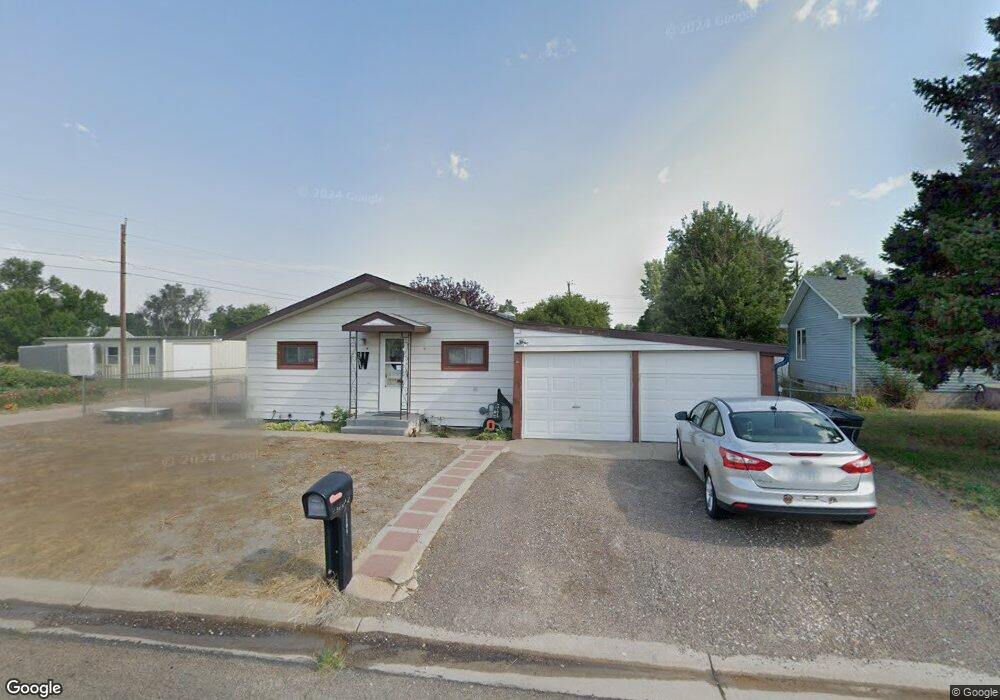
1201 E 3rd St Ogallala, NE 69153
Estimated Value: $187,000 - $211,000
4
Beds
1
Bath
1,196
Sq Ft
$164/Sq Ft
Est. Value
About This Home
This home is located at 1201 E 3rd St, Ogallala, NE 69153 and is currently estimated at $195,807, approximately $163 per square foot. 1201 E 3rd St is a home with nearby schools including Ogallala High School.
Ownership History
Date
Name
Owned For
Owner Type
Purchase Details
Closed on
Apr 25, 2017
Sold by
R & R Investments
Bought by
Walker Michelle R
Current Estimated Value
Home Financials for this Owner
Home Financials are based on the most recent Mortgage that was taken out on this home.
Original Mortgage
$30,000
Outstanding Balance
$24,860
Interest Rate
4.23%
Mortgage Type
Future Advance Clause Open End Mortgage
Estimated Equity
$170,947
Purchase Details
Closed on
Aug 28, 2013
Sold by
Federal National Mortgage Association
Bought by
Valley Bank & Trust Co
Create a Home Valuation Report for This Property
The Home Valuation Report is an in-depth analysis detailing your home's value as well as a comparison with similar homes in the area
Home Values in the Area
Average Home Value in this Area
Purchase History
| Date | Buyer | Sale Price | Title Company |
|---|---|---|---|
| Walker Michelle R | $47,000 | Premier Abstract & Title Inc | |
| Valley Bank & Trust Co | -- | None Available |
Source: Public Records
Mortgage History
| Date | Status | Borrower | Loan Amount |
|---|---|---|---|
| Open | Walker Michelle R | $30,000 |
Source: Public Records
Tax History
| Year | Tax Paid | Tax Assessment Tax Assessment Total Assessment is a certain percentage of the fair market value that is determined by local assessors to be the total taxable value of land and additions on the property. | Land | Improvement |
|---|---|---|---|---|
| 2025 | $1,352 | $126,920 | $19,495 | $107,425 |
| 2024 | $1,398 | $130,855 | $19,495 | $111,360 |
| 2023 | $1,631 | $116,875 | $16,245 | $100,630 |
| 2022 | $1,435 | $90,585 | $13,235 | $77,350 |
| 2021 | $1,385 | $84,640 | $13,235 | $71,405 |
| 2020 | $1,255 | $75,985 | $13,235 | $62,750 |
| 2019 | $1,199 | $69,455 | $12,035 | $57,420 |
| 2018 | $1,136 | $64,550 | $12,035 | $52,515 |
| 2017 | $1,120 | $63,265 | $12,035 | $51,230 |
| 2016 | $1,151 | $63,265 | $12,035 | $51,230 |
| 2015 | $1,039 | $52,885 | $10,030 | $42,855 |
| 2010 | -- | $52,885 | $10,030 | $42,855 |
Source: Public Records
Map
Nearby Homes
Your Personal Tour Guide
Ask me questions while you tour the home.