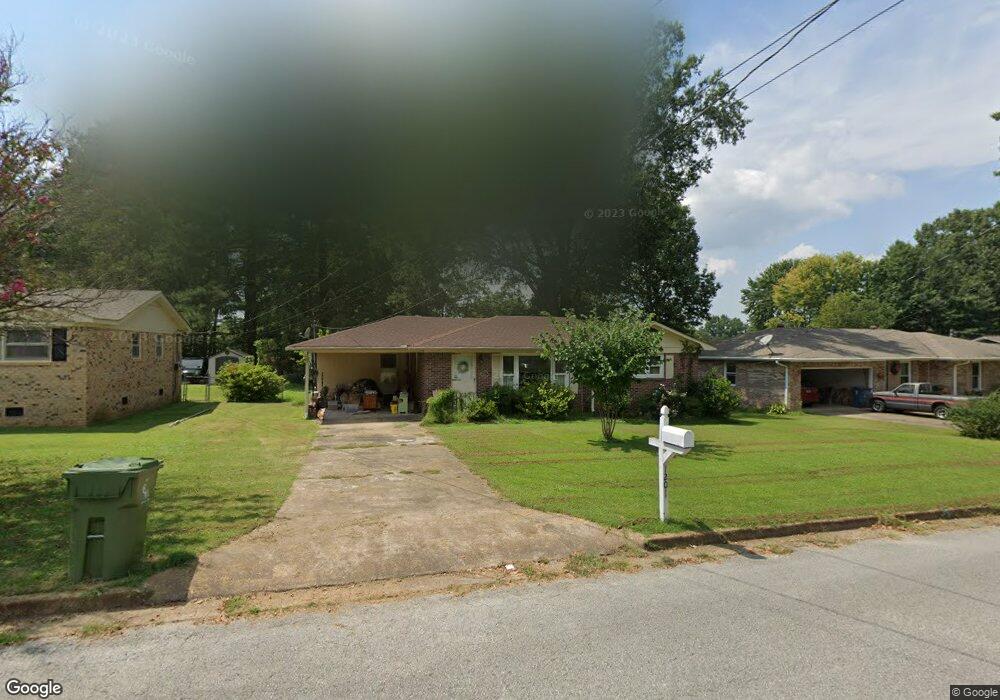
1201 N 28th Ave Humboldt, TN 38343
Estimated Value: $119,000 - $155,000
3
Beds
1
Bath
1,185
Sq Ft
$114/Sq Ft
Est. Value
About This Home
This home is located at 1201 N 28th Ave, Humboldt, TN 38343 and is currently estimated at $134,848, approximately $113 per square foot. 1201 N 28th Ave is a home located in Gibson County with nearby schools including Stigall Primary School, East Elementary School, and Humboldt Middle School.
Ownership History
Date
Name
Owned For
Owner Type
Purchase Details
Closed on
Oct 27, 2017
Sold by
Tidwell Mildred Florine Es
Bought by
Hopper Carl David
Current Estimated Value
Home Financials for this Owner
Home Financials are based on the most recent Mortgage that was taken out on this home.
Original Mortgage
$55,812
Outstanding Balance
$46,631
Interest Rate
3.83%
Mortgage Type
New Conventional
Estimated Equity
$88,217
Purchase Details
Closed on
Jul 30, 2002
Sold by
Tharp Harold
Bought by
Tidwell Mildred F
Purchase Details
Closed on
Aug 8, 1992
Bought by
Tharp Harold and Tharp Sylvia G
Purchase Details
Closed on
Oct 22, 1990
Bought by
Lovett Robert Neil and Lovett Claudene
Purchase Details
Closed on
Mar 25, 1989
Bought by
Lynn Michael B and Lynn Elizabeth C
Purchase Details
Closed on
Oct 10, 1985
Bought by
Croom Ii Wilson B
Purchase Details
Closed on
Jul 17, 1984
Purchase Details
Closed on
May 10, 1983
Purchase Details
Closed on
Jan 4, 1900
Create a Home Valuation Report for This Property
The Home Valuation Report is an in-depth analysis detailing your home's value as well as a comparison with similar homes in the area
Home Values in the Area
Average Home Value in this Area
Purchase History
| Date | Buyer | Sale Price | Title Company |
|---|---|---|---|
| Hopper Carl David | $58,750 | -- | |
| Tidwell Mildred F | $65,000 | -- | |
| Tharp Harold | $46,400 | -- | |
| Lovett Robert Neil | $45,000 | -- | |
| Lynn Michael B | $43,000 | -- | |
| Croom Ii Wilson B | -- | -- | |
| -- | -- | -- | |
| -- | -- | -- | |
| -- | -- | -- |
Source: Public Records
Mortgage History
| Date | Status | Borrower | Loan Amount |
|---|---|---|---|
| Open | Hopper Carl David | $55,812 |
Source: Public Records
Tax History Compared to Growth
Tax History
| Year | Tax Paid | Tax Assessment Tax Assessment Total Assessment is a certain percentage of the fair market value that is determined by local assessors to be the total taxable value of land and additions on the property. | Land | Improvement |
|---|---|---|---|---|
| 2025 | $853 | $31,475 | $0 | $0 |
| 2024 | $853 | $31,475 | $4,000 | $27,475 |
| 2023 | $170 | $15,425 | $2,500 | $12,925 |
| 2022 | $159 | $15,425 | $2,500 | $12,925 |
| 2021 | $159 | $15,425 | $2,500 | $12,925 |
| 2020 | $580 | $15,425 | $2,500 | $12,925 |
| 2019 | $580 | $15,425 | $2,500 | $12,925 |
| 2018 | $619 | $15,250 | $2,500 | $12,750 |
| 2017 | $608 | $15,250 | $2,500 | $12,750 |
| 2016 | $608 | $15,175 | $2,500 | $12,675 |
| 2015 | $603 | $15,175 | $2,500 | $12,675 |
| 2014 | $603 | $15,175 | $2,500 | $12,675 |
Source: Public Records
Map
Nearby Homes
- 1211 N 29th Ave
- 1338 Dungan St
- 3117 Laurel St
- 2508 Vine St
- 804 N 24th Ave
- 811 N 24th Ave
- 2425 St Mary Dr
- 700 N 29th Ave
- 1012 Parkway Cove
- 0 Eastend Dr
- 1320 Eastview Dr
- 2900 E Mitchell St
- 00000 Lot 7 Mullins St
- 0000 lot 6-C Mullins St
- 000Lot 6-B Mullins St
- 00-lot 6-A Mullins St
- 0 +-6 Acres Gadsden Todd Levee Unit 241321
- 2107 Campbell St
- 171 N 28th Ave
- 1549 Eastview Dr
- 1207 N 28th Ave
- 1185 N 28th Ave
- 1135 N 28th Ave
- 1215 N 28th Ave
- 1326 Sunset St
- 1318 Sunset St
- 1204 N 28th Ave
- 1190 N 28th Ave
- 1332 Sunset St
- 1210 N 28th Ave
- 1140 N 28th Ave
- 1314 Sunset St
- 1336 Sunset St
- 1221 N 28th Ave
- 1075 N 28th Ave
- 1402 Sunset St
- 1216 N 28th Ave
- 1222 Sunset St
- 1090 N 28th Ave
- 1218 Sunset St