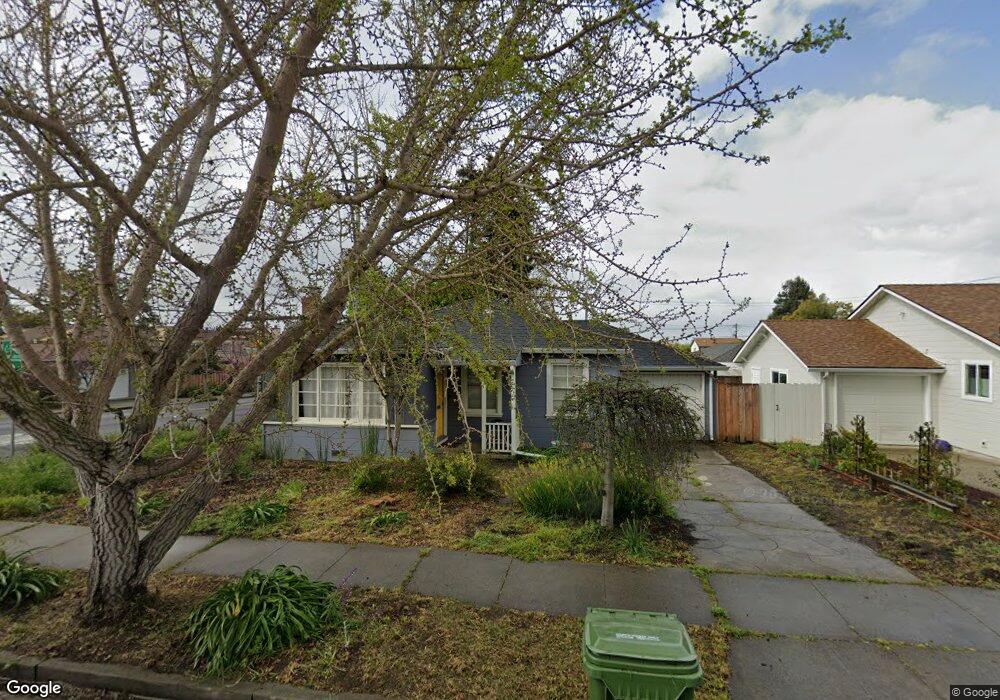
1201 Norvell St El Cerrito, CA 94530
Estimated Value: $890,427 - $1,050,000
3
Beds
1
Bath
1,059
Sq Ft
$927/Sq Ft
Est. Value
About This Home
This home is located at 1201 Norvell St, El Cerrito, CA 94530 and is currently estimated at $981,607, approximately $926 per square foot. 1201 Norvell St is a home located in Contra Costa County with nearby schools including Madera Elementary School, Fred T. Korematsu Middle School, and El Cerrito Senior High School.
Ownership History
Date
Name
Owned For
Owner Type
Purchase Details
Closed on
Aug 28, 2006
Sold by
Chatwin Connie V
Bought by
Aczon Michael
Current Estimated Value
Home Financials for this Owner
Home Financials are based on the most recent Mortgage that was taken out on this home.
Original Mortgage
$416,000
Outstanding Balance
$254,150
Interest Rate
6.99%
Mortgage Type
Negative Amortization
Estimated Equity
$727,457
Purchase Details
Closed on
Aug 25, 2006
Sold by
Aczon Karen
Bought by
Aczon Michael A
Home Financials for this Owner
Home Financials are based on the most recent Mortgage that was taken out on this home.
Original Mortgage
$416,000
Outstanding Balance
$254,150
Interest Rate
6.99%
Mortgage Type
Negative Amortization
Estimated Equity
$727,457
Purchase Details
Closed on
May 28, 2006
Sold by
The Douglas R Obrine Revocable Trust
Bought by
Chatwin Leonard J and Chatwin Connie
Purchase Details
Closed on
Aug 23, 1998
Sold by
Obrine Douglas Richard
Bought by
Douglas R Obrine Revocable Trust
Create a Home Valuation Report for This Property
The Home Valuation Report is an in-depth analysis detailing your home's value as well as a comparison with similar homes in the area
Home Values in the Area
Average Home Value in this Area
Purchase History
| Date | Buyer | Sale Price | Title Company |
|---|---|---|---|
| Aczon Michael | $520,000 | Chicago Title Co | |
| Aczon Michael A | -- | Chicago Title Co | |
| Chatwin Leonard J | -- | None Available | |
| Douglas R Obrine Revocable Trust | -- | None Available |
Source: Public Records
Mortgage History
| Date | Status | Borrower | Loan Amount |
|---|---|---|---|
| Open | Aczon Michael | $416,000 |
Source: Public Records
Tax History
| Year | Tax Paid | Tax Assessment Tax Assessment Total Assessment is a certain percentage of the fair market value that is determined by local assessors to be the total taxable value of land and additions on the property. | Land | Improvement |
|---|---|---|---|---|
| 2025 | $10,108 | $696,672 | $614,955 | $81,717 |
| 2024 | $9,689 | $683,013 | $602,898 | $80,115 |
| 2023 | $9,689 | $669,622 | $591,077 | $78,545 |
| 2022 | $9,538 | $656,493 | $579,488 | $77,005 |
| 2021 | $9,494 | $643,622 | $568,126 | $75,496 |
| 2019 | $8,903 | $624,533 | $551,276 | $73,257 |
| 2018 | $8,591 | $612,288 | $540,467 | $71,821 |
| 2017 | $8,453 | $600,283 | $529,870 | $70,413 |
| 2016 | $8,423 | $588,514 | $519,481 | $69,033 |
| 2015 | $7,407 | $500,000 | $441,350 | $58,650 |
| 2014 | $5,627 | $365,000 | $322,185 | $42,815 |
Source: Public Records
Map
Nearby Homes
- 1244 Liberty St
- 931 Elm St
- 10496 San Pablo Ave
- 10280 San Pablo Ave
- 5801 Madison Ave
- 7755 Earl Ct
- 1342 S 57th St
- 747 Albemarle St
- 1708 Lexington Ave Unit 2
- 1708 Lexington Ave Unit 5
- 1129 S 55th St
- 5355 Bayview Ave
- 6620 Hill St
- 5328 Gately Ave
- 1374 Santa Clara St
- 5622 Huntington Ave
- 6130 Van Fleet Ave
- 1012 Contra Costa Dr
- 1522 Madera Ct
- 7981 Terrace Dr
- 1207 Norvell St
- 1213 Norvell St
- 1206 Everett St
- 1125 Norvell Ct
- 1210 Everett St
- 1126 Norvell Ct
- 1215 Norvell St
- 1212 Everett St
- 1200 Norvell St
- 1204 Norvell St
- 1208 Norvell St
- 1152 Richmond St
- 1216 Everett St
- 1154 Richmond St
- 1221 Norvell St
- 1123 Norvell Ct
- 1156 Richmond St Unit 1156
- 1156 Richmond St
- 1220 Everett St
- 1158 Richmond St
Your Personal Tour Guide
Ask me questions while you tour the home.