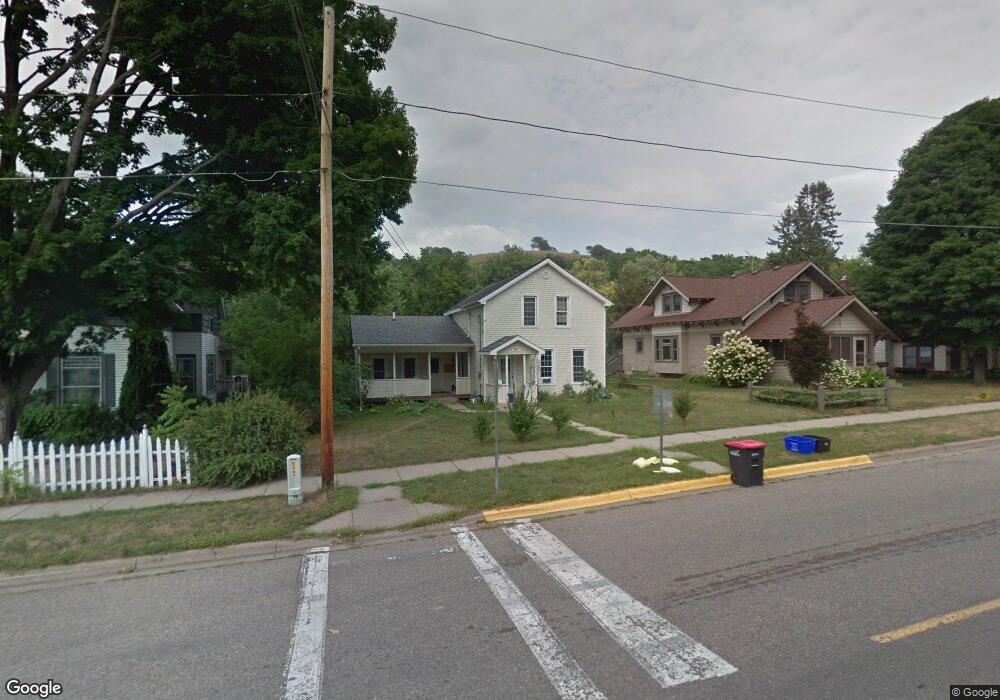
1201 S Park St Red Wing, MN 55066
Estimated Value: $263,115 - $301,000
5
Beds
3
Baths
1,972
Sq Ft
$144/Sq Ft
Est. Value
About This Home
This home is located at 1201 S Park St, Red Wing, MN 55066 and is currently estimated at $283,529, approximately $143 per square foot. 1201 S Park St is a home located in Goodhue County with nearby schools including Sunnyside Elementary School, Burnside Elementary School, and Twin Bluff Middle School.
Ownership History
Date
Name
Owned For
Owner Type
Purchase Details
Closed on
Aug 26, 2015
Sold by
Carpenter Kyle D
Bought by
Early Nathan A and Early Christina A
Current Estimated Value
Purchase Details
Closed on
Nov 18, 2010
Sold by
Federal Home Loan Mortgage Corporation
Bought by
Carpenter Kryle D
Purchase Details
Closed on
Feb 15, 2002
Sold by
Wells Fargo Home Mktg
Bought by
Newton Joel M and Newton Amy M
Purchase Details
Closed on
Aug 9, 1999
Sold by
Lang John J and Lang Jamie
Bought by
Rindahl Daniel M and Rindahl Tara S
Create a Home Valuation Report for This Property
The Home Valuation Report is an in-depth analysis detailing your home's value as well as a comparison with similar homes in the area
Home Values in the Area
Average Home Value in this Area
Purchase History
| Date | Buyer | Sale Price | Title Company |
|---|---|---|---|
| Early Nathan A | $137,000 | Goodhue County Abstract | |
| Carpenter Kryle D | $75,000 | -- | |
| Newton Joel M | $88,000 | -- | |
| Rindahl Daniel M | $90,000 | -- |
Source: Public Records
Tax History Compared to Growth
Tax History
| Year | Tax Paid | Tax Assessment Tax Assessment Total Assessment is a certain percentage of the fair market value that is determined by local assessors to be the total taxable value of land and additions on the property. | Land | Improvement |
|---|---|---|---|---|
| 2025 | $2,864 | $237,400 | $37,500 | $199,900 |
| 2024 | $2,864 | $233,600 | $37,500 | $196,100 |
| 2023 | $1,443 | $221,100 | $37,500 | $183,600 |
| 2022 | $2,490 | $219,700 | $37,500 | $182,200 |
| 2021 | $2,288 | $184,000 | $33,000 | $151,000 |
| 2020 | $2,200 | $173,000 | $33,000 | $140,000 |
| 2019 | $2,146 | $157,900 | $33,000 | $124,900 |
| 2018 | $1,682 | $156,300 | $30,000 | $126,300 |
| 2017 | $1,640 | $136,100 | $30,000 | $106,100 |
| 2016 | $1,500 | $134,700 | $30,000 | $104,700 |
| 2015 | $1,542 | $130,400 | $30,000 | $100,400 |
| 2014 | -- | $124,800 | $30,000 | $94,800 |
Source: Public Records
Map
Nearby Homes
- 1109 East Ave
- 1218 East Ave
- 466 14th St
- 516 Norwood St
- 1524 Bush St
- 759 Plum St
- 1547 Bush St
- 737 McSorley St
- 1416 Phelps St
- XXXX Skyline Heights
- 924 Central Ave
- 613 Potter St
- 716 Central Ave
- 523 East Ave Unit 211
- 523 East Ave Unit 213
- 642 Grace St
- 802 West Ave
- 1218 Central Ave
- 225 E 5th St
- 528 20th St