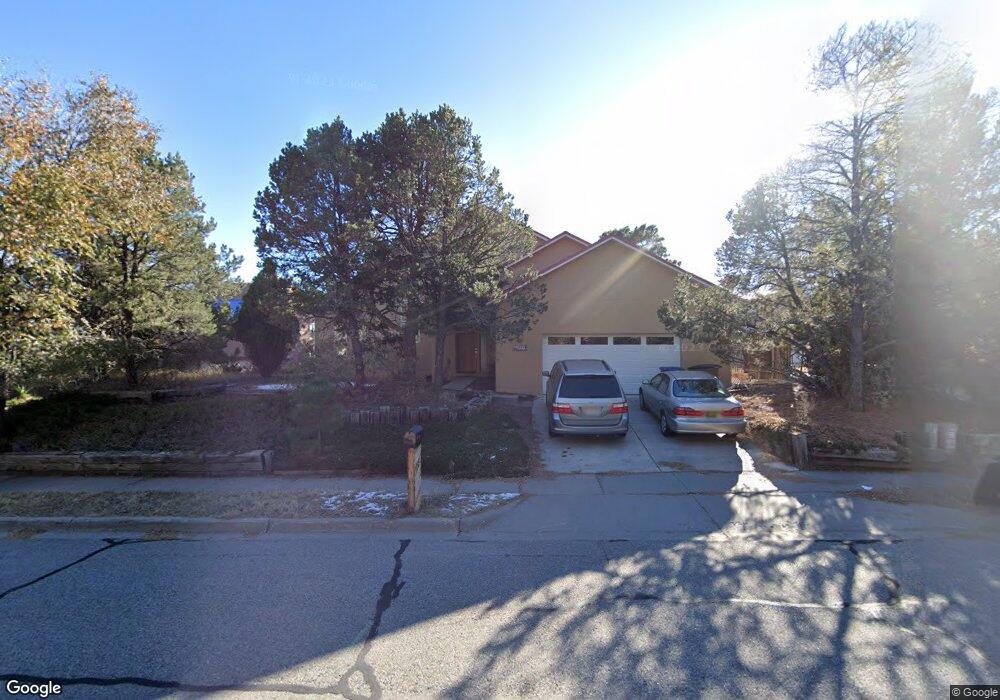
1201 San Ildefonso Rd Los Alamos, NM 87544
Estimated Value: $838,000 - $882,000
4
Beds
3
Baths
3,234
Sq Ft
$263/Sq Ft
Est. Value
About This Home
This home is located at 1201 San Ildefonso Rd, Los Alamos, NM 87544 and is currently estimated at $850,094, approximately $262 per square foot. 1201 San Ildefonso Rd is a home located in Los Alamos County with nearby schools including Barranca Mesa Elementary School, Los Alamos Middle School, and Los Alamos High School.
Ownership History
Date
Name
Owned For
Owner Type
Purchase Details
Closed on
Jul 24, 2019
Sold by
Sandborgh Sean C and Sandborgh Skye L
Bought by
Sandborgh Sean C and Sandborgh Skye L
Current Estimated Value
Purchase Details
Closed on
Aug 16, 2018
Sold by
Belooussov Andrei and Belooussov Olga
Bought by
Sandborgh Sean C and Sandborgh Skye L
Home Financials for this Owner
Home Financials are based on the most recent Mortgage that was taken out on this home.
Original Mortgage
$412,400
Outstanding Balance
$251,744
Interest Rate
4.5%
Mortgage Type
New Conventional
Estimated Equity
$598,350
Purchase Details
Closed on
Jul 15, 2009
Sold by
Beloousov Andrei and Beloousov Olga
Bought by
Belooussov Andrei and Belooussova Olga
Home Financials for this Owner
Home Financials are based on the most recent Mortgage that was taken out on this home.
Original Mortgage
$25,200
Interest Rate
6.62%
Mortgage Type
Adjustable Rate Mortgage/ARM
Create a Home Valuation Report for This Property
The Home Valuation Report is an in-depth analysis detailing your home's value as well as a comparison with similar homes in the area
Purchase History
| Date | Buyer | Sale Price | Title Company |
|---|---|---|---|
| Sandborgh Sean C | -- | None Available | |
| Sandborgh Sean C | -- | Title Guaranty Llc | |
| Belooussov Andrei | -- | -- |
Source: Public Records
Mortgage History
| Date | Status | Borrower | Loan Amount |
|---|---|---|---|
| Open | Sandborgh Sean C | $412,400 | |
| Previous Owner | Belooussov Andrei | $25,200 |
Source: Public Records
Tax History
| Year | Tax Paid | Tax Assessment Tax Assessment Total Assessment is a certain percentage of the fair market value that is determined by local assessors to be the total taxable value of land and additions on the property. | Land | Improvement |
|---|---|---|---|---|
| 2025 | $5,365 | $226,020 | $50,380 | $175,640 |
| 2024 | $5,171 | $219,440 | $49,420 | $170,020 |
| 2023 | $5,114 | $213,040 | $48,170 | $164,870 |
| 2022 | $4,997 | $206,840 | $47,000 | $159,840 |
| 2021 | $4,835 | $200,820 | $45,990 | $154,830 |
| 2020 | $4,783 | $194,970 | $45,410 | $149,560 |
| 2019 | $4,716 | $189,290 | $43,190 | $146,100 |
| 2018 | $3,800 | $151,480 | $32,240 | $119,240 |
| 2017 | $3,658 | $144,960 | $31,380 | $113,580 |
| 2016 | $3,430 | $140,740 | $30,720 | $110,020 |
| 2015 | $3,338 | $136,640 | $29,640 | $107,000 |
| 2014 | $2,996 | $132,660 | $29,640 | $103,020 |
| 2013 | $3,043 | $133,330 | $32,220 | $101,110 |
| 2011 | $2,921 | $135,560 | $30,770 | $104,790 |
Source: Public Records
Map
Nearby Homes
- 1015 Alamo Rd
- 945 San Ildefonso Rd Unit 73
- 945 San Ildefonso Rd Unit 16
- 881 Camino Encantado
- 253 San Juan St
- 710 Camino Encantado
- 585 Navajo Rd
- 80 Canyon Rd
- 487 Myrtle St
- 1303 Sage Loop
- 2176 La Tierra Rd
- 1001 Oppenheimer Dr Unit 122
- 2861 Nickel St
- 3050 Walnut St Unit A
- 505 Oppenheimer Dr Unit 504
- 505 Oppenheimer Dr Unit 904
- 505 Oppenheimer Dr Unit 806
- 505 Oppenheimer Dr Unit 108
- 3055 Trinity Dr Unit 421
- 175 Maple Dr
- 1213 San Ildefonso Rd
- 1193 San Ildefonso Rd
- 1183 San Ildefonso Rd
- 1231 San Ildefonso Rd
- 1171 San Ildefonso Rd
- 1203 Big Rock Loop
- 1211 Big Rock Loop
- 1195 Big Rock Loop
- 1185 Big Rock Loop
- 1239 San Ildefonso Rd
- 1157 San Ildefonso Rd
- 1219 Big Rock Loop
- 1173 Big Rock Loop
- 1227 Big Rock Loop
- 1235 Big Rock Loop
- 1247 San Ildefonso Rd
- 1163 Big Rock Loop
- 1137 San Ildefonso Rd
- 1196 Big Rock Loop
- 1151 Big Rock Loop
Your Personal Tour Guide
Ask me questions while you tour the home.