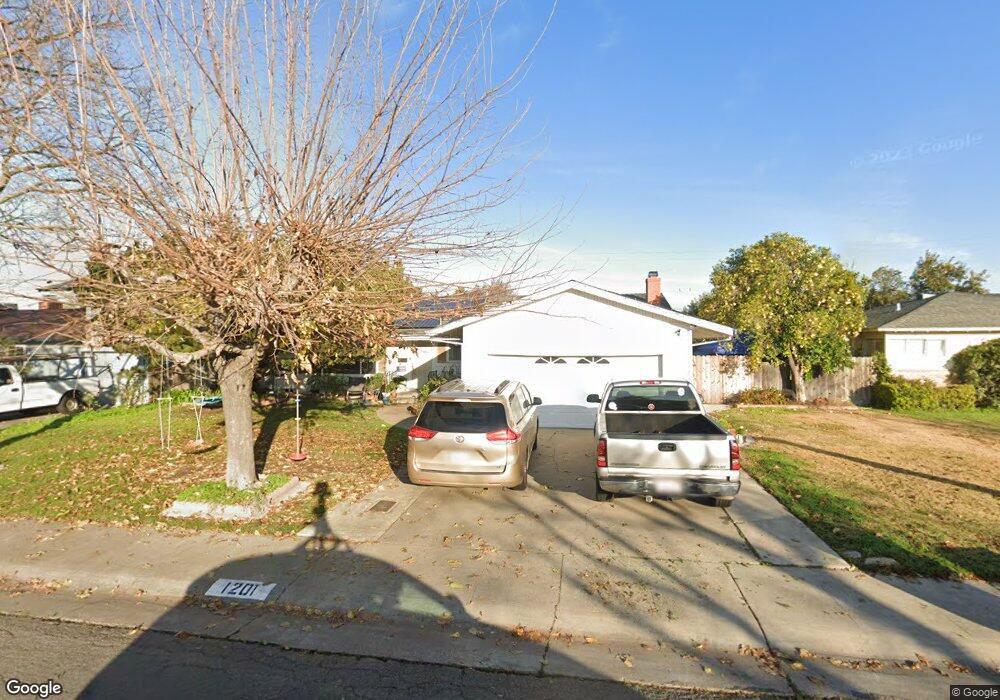
1201 W Churchill St Stockton, CA 95207
Lincoln Village NeighborhoodEstimated Value: $383,000 - $415,000
3
Beds
2
Baths
1,490
Sq Ft
$269/Sq Ft
Est. Value
About This Home
This home is located at 1201 W Churchill St, Stockton, CA 95207 and is currently estimated at $400,892, approximately $269 per square foot. 1201 W Churchill St is a home located in San Joaquin County with nearby schools including Madison Elementary School, Flora Arca Mata, and Hoover Elementary School.
Ownership History
Date
Name
Owned For
Owner Type
Purchase Details
Closed on
Aug 17, 2016
Sold by
Infelise Carl James and Infelise Regina Renee
Bought by
Johnson Ryan P and Johnson Denise E
Current Estimated Value
Home Financials for this Owner
Home Financials are based on the most recent Mortgage that was taken out on this home.
Original Mortgage
$176,739
Outstanding Balance
$142,765
Interest Rate
3.87%
Mortgage Type
FHA
Estimated Equity
$258,127
Purchase Details
Closed on
Dec 13, 2013
Sold by
Infelise Carl
Bought by
Infelise Carl James and Infelise Regina Renee
Purchase Details
Closed on
Apr 25, 2013
Sold by
Infelise Carl and Minnie Infelise 2001 Revocable
Bought by
Infelise Carl and Hall Kathy Alexis
Purchase Details
Closed on
Sep 24, 2001
Sold by
Infelise Minnie
Bought by
Infelise Minnie and Minnie Infelise 2001 Revocable
Create a Home Valuation Report for This Property
The Home Valuation Report is an in-depth analysis detailing your home's value as well as a comparison with similar homes in the area
Home Values in the Area
Average Home Value in this Area
Purchase History
| Date | Buyer | Sale Price | Title Company |
|---|---|---|---|
| Johnson Ryan P | $180,000 | Chicago Title Company | |
| Infelise Carl James | -- | None Available | |
| Infelise Carl | -- | None Available | |
| Infelise Minnie | -- | -- |
Source: Public Records
Mortgage History
| Date | Status | Borrower | Loan Amount |
|---|---|---|---|
| Open | Johnson Ryan P | $176,739 |
Source: Public Records
Tax History Compared to Growth
Tax History
| Year | Tax Paid | Tax Assessment Tax Assessment Total Assessment is a certain percentage of the fair market value that is determined by local assessors to be the total taxable value of land and additions on the property. | Land | Improvement |
|---|---|---|---|---|
| 2025 | $3,621 | $143,949 | $51,546 | $92,403 |
| 2024 | $4,164 | $141,128 | $50,536 | $90,592 |
| 2023 | $3,551 | $138,362 | $49,546 | $88,816 |
| 2022 | $3,490 | $135,650 | $48,575 | $87,075 |
| 2021 | $3,423 | $132,991 | $47,623 | $85,368 |
| 2020 | $3,410 | $131,628 | $47,135 | $84,493 |
| 2019 | $3,403 | $129,048 | $46,211 | $82,837 |
| 2018 | $3,367 | $126,518 | $45,305 | $81,213 |
| 2017 | $3,946 | $180,000 | $75,000 | $105,000 |
| 2016 | $879 | $66,742 | $13,564 | $53,178 |
| 2014 | $838 | $64,452 | $13,098 | $51,354 |
Source: Public Records
Map
Nearby Homes
- 1217 W Churchill St
- 4114 Crown Ave
- 1516 Fog Bank Dr
- 1534 Cat Tail Dr
- 1517 Christina Ave
- 1533 Christina Ave
- 3833 Stepping Stone Way
- 1420 Princeton Ave
- 3319 N Pershing Ave
- 1618 Princeton Ave
- 4332 Pacific Ave Unit 42
- 4332 Pacific Ave Unit 65
- 217 W Essex St
- 815 W Euclid Ave
- 844 W Euclid Ave
- 1854 de Ovan Ave
- 3555 Grange Ave
- 2329 Lido Cir
- 328 Northbank Ct Unit 32
- 4401 Bidwell Place
- 1205 W Churchill St
- 1121 W Churchill St
- 1202 W Downs St Unit 1
- 1130 W Downs St
- 1206 W Downs St
- 1126 W Downs St
- 1202 W Churchill St
- 1117 W Churchill St
- 1209 W Churchill St
- 1122 W Churchill St
- 1206 W Churchill St
- 1210 W Downs St
- 1122 W Downs St
- 1118 W Churchill St
- 1210 W Churchill St
- 1113 W Churchill St
- 1213 W Churchill St
- 1214 W Downs St
- 1201 Brookside Rd
- 1201 W Downs St