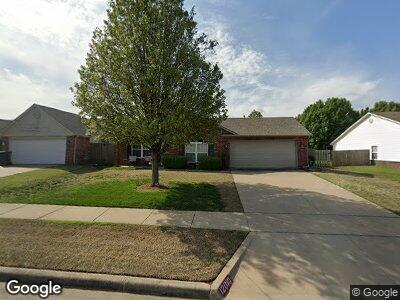
12010 E 111th St N Owasso, OK 74055
Estimated Value: $233,000 - $255,000
3
Beds
2
Baths
1,488
Sq Ft
$163/Sq Ft
Est. Value
About This Home
This home is located at 12010 E 111th St N, Owasso, OK 74055 and is currently estimated at $242,847, approximately $163 per square foot. 12010 E 111th St N is a home located in Tulsa County with nearby schools including Hayward Smith Elementary School, Owasso 6th Grade Center, and Owasso 8th Grade Center.
Ownership History
Date
Name
Owned For
Owner Type
Purchase Details
Closed on
Mar 12, 2025
Sold by
Chisolm Gloria J
Bought by
Gloria J Chisolm Revocable Living Trust
Current Estimated Value
Purchase Details
Closed on
Feb 19, 2009
Sold by
Alexander Simon D and Alexander Christy L
Bought by
Chisolm Gloria Jean
Home Financials for this Owner
Home Financials are based on the most recent Mortgage that was taken out on this home.
Original Mortgage
$125,681
Interest Rate
5.13%
Mortgage Type
FHA
Purchase Details
Closed on
Sep 21, 2006
Sold by
Rausch Coleman Homes Of Tulsa Llc
Bought by
Alexander Simon D and Alexander Christy L
Home Financials for this Owner
Home Financials are based on the most recent Mortgage that was taken out on this home.
Original Mortgage
$98,000
Interest Rate
6.44%
Mortgage Type
Purchase Money Mortgage
Create a Home Valuation Report for This Property
The Home Valuation Report is an in-depth analysis detailing your home's value as well as a comparison with similar homes in the area
Home Values in the Area
Average Home Value in this Area
Purchase History
| Date | Buyer | Sale Price | Title Company |
|---|---|---|---|
| Gloria J Chisolm Revocable Living Trust | -- | None Listed On Document | |
| Chisolm Gloria Jean | $128,000 | Premier Title & Escrow Servi | |
| Alexander Simon D | $122,500 | Beacon Title Company |
Source: Public Records
Mortgage History
| Date | Status | Borrower | Loan Amount |
|---|---|---|---|
| Previous Owner | Chisolm Gloria Jean | $111,200 | |
| Previous Owner | Chisolm Gloria Jean | $125,681 | |
| Previous Owner | Alexander Simon D | $98,000 | |
| Previous Owner | Alexander Simon D | $24,500 |
Source: Public Records
Tax History Compared to Growth
Tax History
| Year | Tax Paid | Tax Assessment Tax Assessment Total Assessment is a certain percentage of the fair market value that is determined by local assessors to be the total taxable value of land and additions on the property. | Land | Improvement |
|---|---|---|---|---|
| 2024 | $1,619 | $15,349 | $1,744 | $13,605 |
| 2023 | $1,619 | $15,872 | $1,851 | $14,021 |
| 2022 | $1,638 | $14,410 | $2,378 | $12,032 |
| 2021 | $1,571 | $13,961 | $2,566 | $11,395 |
| 2020 | $1,571 | $13,961 | $2,566 | $11,395 |
| 2019 | $1,561 | $13,938 | $2,562 | $11,376 |
| 2018 | $1,465 | $13,503 | $2,482 | $11,021 |
| 2017 | $1,424 | $14,080 | $2,750 | $11,330 |
| 2016 | $1,429 | $14,080 | $2,750 | $11,330 |
| 2015 | $1,440 | $14,080 | $2,750 | $11,330 |
| 2014 | $1,453 | $14,080 | $2,750 | $11,330 |
Source: Public Records
Map
Nearby Homes
- 11013 N 121st Ave E
- 11213 N 120th Ave E
- 11001 N 117th Place E
- 10915 N 117th Place E
- 10904 N 120th East Ave
- 11427 E 110th Place N
- 10902 N 117th Place E
- 11704 E 109th St N
- 11702 E 116th St N
- 12008 E 115th Place N
- 11610 E 116th St N
- 11822 E N
- 0 E 112th St N Unit 2513203
- 12026 E 106th Place N
- 10602 N 120th Ct E
- 12506 E 116th St N
- 11408 N 129th Ave E
- 11850 E 106th St N
- 11318 N 112th Ave E
- 125525 E 116th St N
- 12010 E 111th St N
- 12008 E 111th St N
- 12012 E 111th St N
- 12006 E 111th St N
- 0 E 111th St Unit 2316877
- 0 E 111th St Unit 1831967
- 0 E 111th St Unit 2125505
- 0 E 111th St Unit 2138046
- 0 E 111th St Unit 2203983
- 12014 E 111th St N
- 12019 E 110th Ct N
- 12004 E 111th St N
- 12016 E 111th St N
- 12025 E 111th St N
- 12002 E 111th St N
- 12021 E 110th Ct N
- 12018 E 111th St N
- 11101 N 120th East Ave
- 12014 E 110th Ct N
- 11105 N 120th Ave E