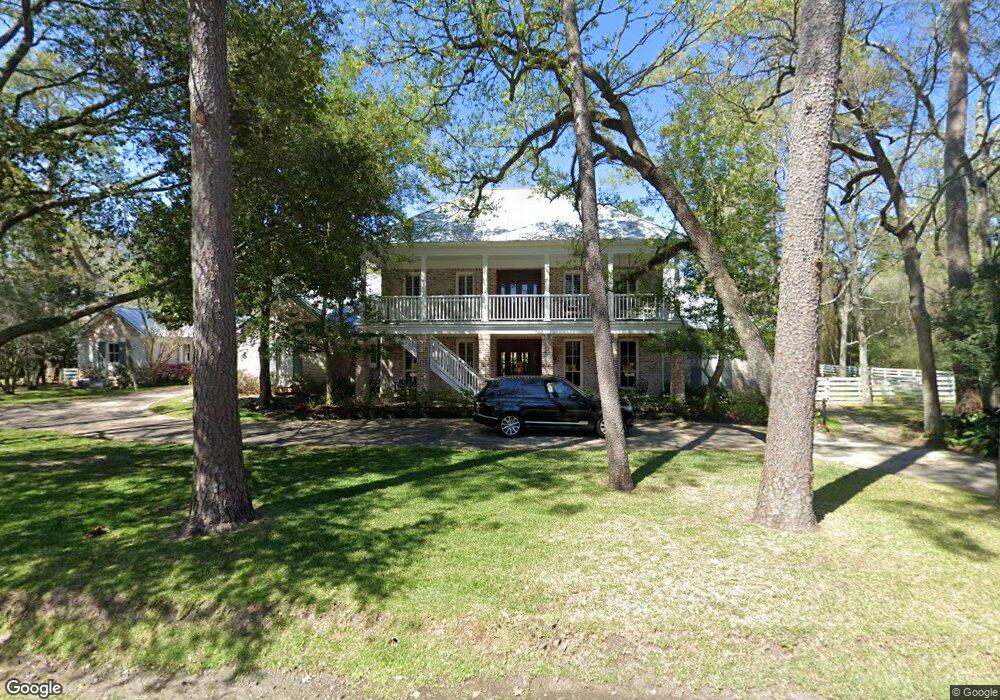
12010 Tall Oaks St Houston, TX 77024
Estimated Value: $2,766,000 - $3,250,000
4
Beds
6
Baths
5,266
Sq Ft
$558/Sq Ft
Est. Value
About This Home
This home is located at 12010 Tall Oaks St, Houston, TX 77024 and is currently estimated at $2,939,713, approximately $558 per square foot. 12010 Tall Oaks St is a home located in Harris County with nearby schools including Bunker Hill Elementary School, Memorial Middle, and Memorial High School.
Ownership History
Date
Name
Owned For
Owner Type
Purchase Details
Closed on
Apr 15, 2015
Sold by
Lubel Lance and Mccally Sharon Sue
Bought by
Strutton Michael Daren and Strutton Tamara W
Current Estimated Value
Home Financials for this Owner
Home Financials are based on the most recent Mortgage that was taken out on this home.
Original Mortgage
$1,566,250
Outstanding Balance
$1,189,292
Interest Rate
3.37%
Mortgage Type
Adjustable Rate Mortgage/ARM
Estimated Equity
$1,750,421
Purchase Details
Closed on
Oct 11, 2007
Sold by
Groth Carl Edward and Kanaly Trust Co
Bought by
Lubel Lance and Lubel Sharon
Purchase Details
Closed on
May 15, 2000
Sold by
Groth Elizabeth Oxholm
Bought by
Qualifi Groth Elizabeth Oxholm and Qualifi Elizabeth Oxholm Groth
Create a Home Valuation Report for This Property
The Home Valuation Report is an in-depth analysis detailing your home's value as well as a comparison with similar homes in the area
Home Values in the Area
Average Home Value in this Area
Purchase History
| Date | Buyer | Sale Price | Title Company |
|---|---|---|---|
| Strutton Michael Daren | -- | None Available | |
| Lubel Lance | -- | None Available | |
| Qualifi Groth Elizabeth Oxholm | -- | -- | |
| Per Groth Jr Edward | -- | -- |
Source: Public Records
Mortgage History
| Date | Status | Borrower | Loan Amount |
|---|---|---|---|
| Open | Strutton Michael Daren | $1,566,250 |
Source: Public Records
Tax History Compared to Growth
Tax History
| Year | Tax Paid | Tax Assessment Tax Assessment Total Assessment is a certain percentage of the fair market value that is determined by local assessors to be the total taxable value of land and additions on the property. | Land | Improvement |
|---|---|---|---|---|
| 2025 | $35,401 | $2,323,068 | $1,427,712 | $895,356 |
| 2024 | $35,401 | $2,252,986 | $1,427,712 | $825,274 |
| 2023 | $35,401 | $2,270,280 | $1,427,712 | $842,568 |
| 2022 | $41,328 | $1,987,588 | $1,427,712 | $559,876 |
| 2021 | $41,862 | $1,933,022 | $1,320,634 | $612,388 |
| 2020 | $39,864 | $1,800,000 | $1,320,634 | $479,366 |
| 2019 | $41,520 | $1,800,000 | $1,320,634 | $479,366 |
| 2018 | $9,321 | $1,834,400 | $1,320,634 | $513,766 |
| 2017 | $42,314 | $1,834,400 | $1,320,634 | $513,766 |
| 2016 | $44,520 | $1,930,031 | $1,320,634 | $609,397 |
| 2015 | $29,779 | $1,938,134 | $1,320,634 | $617,500 |
| 2014 | $29,779 | $1,948,586 | $1,320,634 | $627,952 |
Source: Public Records
Map
Nearby Homes
- 12003 Tall Oaks St
- 601 Strey Ln
- 11910 Heritage Ln
- 345 Knipp Rd
- 234 Plantation Rd
- 318 Knipp Rd
- 12222 Broken Bough Dr
- 12334 Beauregard Dr
- 12326 Old Oaks Dr
- 307 Chapel Belle Ln
- 11718 Broken Bough Cir
- 711 Timber Hill Dr
- 358 Tealwood Dr
- 354 Tealwood Dr
- 12406 Overcup Dr
- 12 Gage Ct
- 12327 Tunbridge Ln
- 170 Haversham Dr
- 0 Gessner Rd
- 201 Vanderpool Ln Unit 103
- 451 Strey Ln
- 12014 Tall Oaks St
- 1 Patrick Ct
- 2 Rip Van Winkle Ln
- 431 Strey Ln
- 1 Lazee Trail
- 4 Lazee Trail
- 1 Rip Van Winkle Ln
- 2 Patrick Ct
- 12017 Tall Oaks St
- 12020 Tall Oaks St
- 3 Patrick Ct
- 12021 Tall Oaks St
- 1 Duchess Ct
- 12010 Surrey Ln
- 5 Lazee Trail
- 12014 Surrey Ln
- 4 Rip Van Winkle Ln
- 11934 Surrey Ln
- 4 Patrick Ct