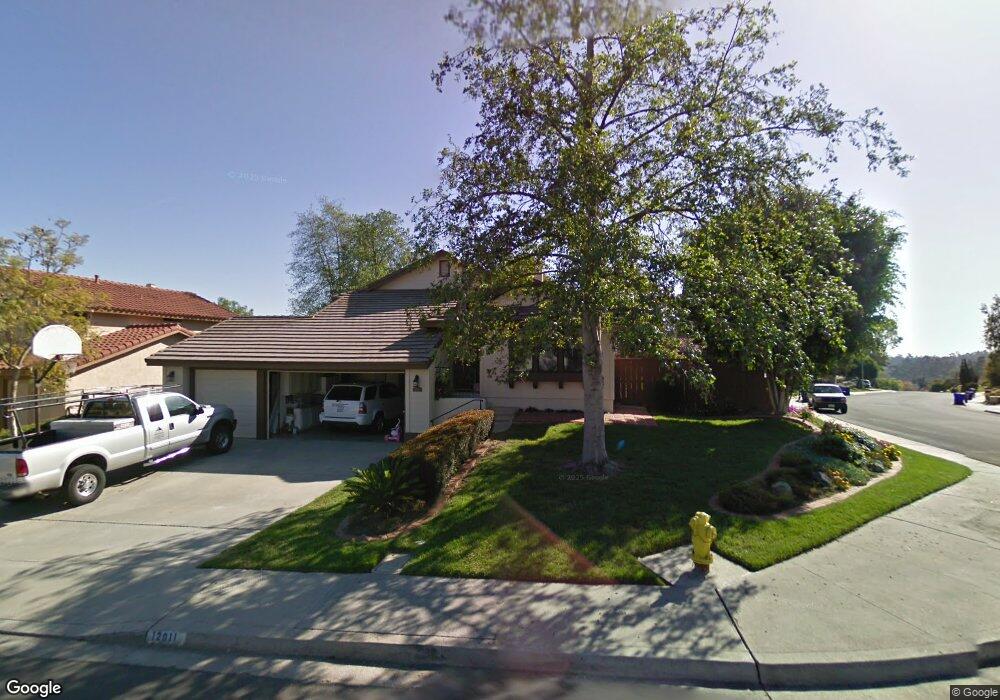
12011 Redcliff Ct San Diego, CA 92131
Scripps Ranch NeighborhoodEstimated Value: $1,487,000 - $1,548,000
4
Beds
3
Baths
2,184
Sq Ft
$693/Sq Ft
Est. Value
About This Home
This home is located at 12011 Redcliff Ct, San Diego, CA 92131 and is currently estimated at $1,513,444, approximately $692 per square foot. 12011 Redcliff Ct is a home located in San Diego County with nearby schools including Jerabek Elementary School, Thurgood Marshall Middle School, and Scripps Ranch High School.
Ownership History
Date
Name
Owned For
Owner Type
Purchase Details
Closed on
Jan 2, 2002
Sold by
Bushman Joseph and Bushman Kristina
Bought by
Bushman Joseph and Bushman Kristina Dee
Current Estimated Value
Purchase Details
Closed on
Nov 20, 1998
Sold by
Desouchet William L and Desouchet Janis B
Bought by
Bushman Joseph and Bushman Kristina
Home Financials for this Owner
Home Financials are based on the most recent Mortgage that was taken out on this home.
Original Mortgage
$200,000
Outstanding Balance
$44,693
Interest Rate
6.86%
Estimated Equity
$1,468,751
Purchase Details
Closed on
Oct 31, 1994
Sold by
Motley Thomas G and Motley Kathleen A
Bought by
Desouchet William L and Desouchet Janis B
Home Financials for this Owner
Home Financials are based on the most recent Mortgage that was taken out on this home.
Original Mortgage
$220,000
Interest Rate
8.78%
Purchase Details
Closed on
Oct 31, 1985
Create a Home Valuation Report for This Property
The Home Valuation Report is an in-depth analysis detailing your home's value as well as a comparison with similar homes in the area
Home Values in the Area
Average Home Value in this Area
Purchase History
| Date | Buyer | Sale Price | Title Company |
|---|---|---|---|
| Bushman Joseph | -- | -- | |
| Bushman Joseph | $305,000 | Fidelity National Title | |
| Desouchet William L | $275,000 | Union Land Title Company | |
| -- | $174,900 | -- |
Source: Public Records
Mortgage History
| Date | Status | Borrower | Loan Amount |
|---|---|---|---|
| Open | Bushman Joseph | $200,000 | |
| Previous Owner | Desouchet William L | $220,000 |
Source: Public Records
Tax History Compared to Growth
Tax History
| Year | Tax Paid | Tax Assessment Tax Assessment Total Assessment is a certain percentage of the fair market value that is determined by local assessors to be the total taxable value of land and additions on the property. | Land | Improvement |
|---|---|---|---|---|
| 2025 | $5,926 | $478,129 | $156,643 | $321,486 |
| 2024 | $5,926 | $468,755 | $153,572 | $315,183 |
| 2023 | $5,788 | $459,564 | $150,561 | $309,003 |
| 2022 | $5,624 | $450,554 | $147,609 | $302,945 |
| 2021 | $5,574 | $441,720 | $144,715 | $297,005 |
| 2020 | $5,505 | $437,192 | $143,232 | $293,960 |
| 2019 | $5,405 | $428,621 | $140,424 | $288,197 |
| 2018 | $5,058 | $420,218 | $137,671 | $282,547 |
| 2017 | $4,935 | $411,979 | $134,972 | $277,007 |
| 2016 | $4,854 | $403,902 | $132,326 | $271,576 |
| 2015 | $4,780 | $397,836 | $130,339 | $267,497 |
| 2014 | $4,704 | $390,044 | $127,786 | $262,258 |
Source: Public Records
Map
Nearby Homes
- 12026 Medoc Ln
- 12061 Rue Des Amis
- 10575 Spruce Grove Ave
- 11954 Cypress Valley Dr
- 10304 Spruce Grove Ave
- 11495 Cypress Canyon Rd
- 10976 Caminito Alto
- 12432 Caminito Brioso
- 10616 Falcon Rim Point
- 11837 La Colina Rd
- 11393 Vista Elevada
- 11787 La Colina Rd
- 10415 Mesa Madera Dr
- 11721 Treadwell Dr
- 12516 Rougemont Place
- 11148 Twinleaf Way
- 9975 Rue Chantemar
- 10535 Arbor Park Place
- 11313 Wild Meadow Place
- 11964 Ashley Place
- 12021 Redcliff Ct
- 10771 Oakbend Dr
- 12031 Redcliff Ct
- 10780 Oakbend Dr
- 10770 Oakbend Dr
- 10761 Oakbend Dr
- 12010 Redcliff Ct
- 12020 Redcliff Ct
- 10790 Oakbend Dr
- 10760 Oakbend Dr
- 12030 Redcliff Ct
- 10798 Oakbend Dr
- 10750 Oakbend Dr
- 10741 Oakbend Dr
- 12040 Redcliff Ct
- 10740 Oakbend Dr
- 12011 Deerfoot Rd
- 12025 Deerfoot Rd
- 12003 Deerfoot Rd
- 12037 Deerfoot Rd