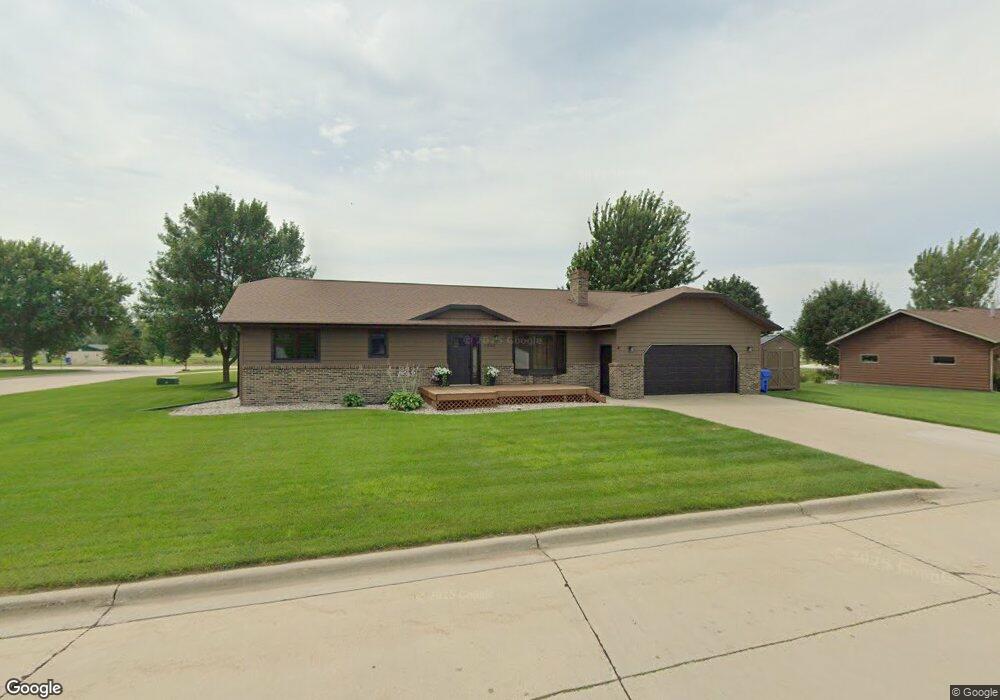
1202 3rd St NW Pipestone, MN 56164
Estimated Value: $145,000 - $410,000
Studio
--
Bath
--
Sq Ft
11,500
Sq Ft Lot
About This Home
This home is located at 1202 3rd St NW, Pipestone, MN 56164 and is currently estimated at $300,697. 1202 3rd St NW is a home located in Pipestone County with nearby schools including Pipestone Elementary School, Brown Elementary School, and Pipestone Head Start.
Ownership History
Date
Name
Owned For
Owner Type
Purchase Details
Closed on
Oct 14, 2020
Sold by
Burnett Aaron M and Burnett Melissa J
Bought by
Sterud Scott and Sterud Marit
Current Estimated Value
Home Financials for this Owner
Home Financials are based on the most recent Mortgage that was taken out on this home.
Original Mortgage
$204,000
Outstanding Balance
$181,447
Interest Rate
2.9%
Mortgage Type
New Conventional
Estimated Equity
$119,250
Purchase Details
Closed on
Dec 4, 2017
Sold by
Kanthak Daryl J and Kanthak Tina L
Bought by
Burnett Aaron and Burnett Melissa
Home Financials for this Owner
Home Financials are based on the most recent Mortgage that was taken out on this home.
Original Mortgage
$178,774
Interest Rate
4.62%
Mortgage Type
FHA
Purchase Details
Closed on
Jan 29, 2017
Sold by
Kanthak Daryl J and Kanthak Tina L
Bought by
Burnett Aaron M and Burnett Melissa J
Create a Home Valuation Report for This Property
The Home Valuation Report is an in-depth analysis detailing your home's value as well as a comparison with similar homes in the area
Home Values in the Area
Average Home Value in this Area
Purchase History
| Date | Buyer | Sale Price | Title Company |
|---|---|---|---|
| Sterud Scott | $240,000 | Pipestone Abstract & Title C | |
| Burnett Aaron | $195,000 | None Available | |
| Burnett Aaron M | $195,000 | None Available |
Source: Public Records
Mortgage History
| Date | Status | Borrower | Loan Amount |
|---|---|---|---|
| Open | Sterud Scott | $204,000 | |
| Previous Owner | Burnett Aaron | $178,774 |
Source: Public Records
Tax History
| Year | Tax Paid | Tax Assessment Tax Assessment Total Assessment is a certain percentage of the fair market value that is determined by local assessors to be the total taxable value of land and additions on the property. | Land | Improvement |
|---|---|---|---|---|
| 2025 | $4,456 | $316,100 | $32,300 | $283,800 |
| 2024 | $4,456 | $338,800 | $32,300 | $306,500 |
| 2023 | $3,930 | $298,200 | $32,300 | $265,900 |
| 2022 | $3,438 | $261,300 | $26,900 | $234,400 |
| 2021 | $3,294 | $221,800 | $26,900 | $194,900 |
| 2020 | $3,284 | $212,100 | $26,900 | $185,200 |
| 2019 | $3,140 | $210,100 | $26,900 | $183,200 |
| 2018 | $2,688 | $202,400 | $26,900 | $175,500 |
| 2017 | $2,712 | $181,900 | $26,900 | $155,000 |
| 2016 | $2,554 | $0 | $0 | $0 |
| 2015 | $2,730 | $157,300 | $19,828 | $137,472 |
| 2014 | $2,730 | $157,500 | $19,831 | $137,669 |
Source: Public Records
Map
Nearby Homes
- 1201 2nd St NW
- 1206 3rd St NW
- 1203 3rd St NW
- 1205 2nd St NW
- 203 12th Ave NW
- 1205 3rd St NW
- 201 12th Ave NW
- 1201 3rd St NW
- 204 11th Ave NW
- 202 11th Ave NW
- 206 11th Ave NW
- 203 11th Ave NW
- 201 11th Ave NW
- 205 11th Ave NW
- 204 10th Ave NW
- 202 10th Ave NW
- 206 10th Ave NW
- 920 2nd St NW Unit 305
- 920 2nd St NW Unit 304
- 920 2nd St NW Unit 302
Your Personal Tour Guide
Ask me questions while you tour the home.