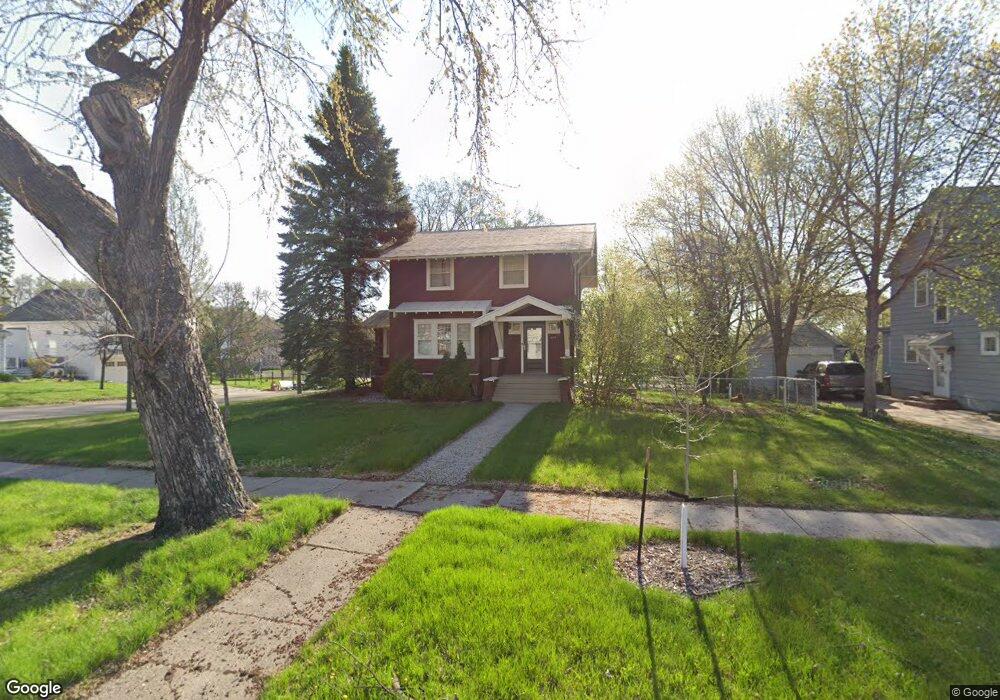
1202 6th St S Fargo, ND 58103
Hawthorne NeighborhoodEstimated Value: $264,000 - $353,000
3
Beds
2
Baths
1,651
Sq Ft
$189/Sq Ft
Est. Value
About This Home
This home is located at 1202 6th St S, Fargo, ND 58103 and is currently estimated at $311,662, approximately $188 per square foot. 1202 6th St S is a home located in Cass County with nearby schools including Clara Barton Elementary School, Ben Franklin Middle School, and South High School.
Ownership History
Date
Name
Owned For
Owner Type
Purchase Details
Closed on
Jul 20, 2005
Sold by
Bortnem Peter E and Bortnem Kristin M
Bought by
Vasichek Shawn R and Vasichek Lanelle R
Current Estimated Value
Home Financials for this Owner
Home Financials are based on the most recent Mortgage that was taken out on this home.
Original Mortgage
$140,850
Outstanding Balance
$73,620
Interest Rate
5.68%
Mortgage Type
New Conventional
Estimated Equity
$238,042
Create a Home Valuation Report for This Property
The Home Valuation Report is an in-depth analysis detailing your home's value as well as a comparison with similar homes in the area
Home Values in the Area
Average Home Value in this Area
Purchase History
| Date | Buyer | Sale Price | Title Company |
|---|---|---|---|
| Vasichek Shawn R | -- | -- |
Source: Public Records
Mortgage History
| Date | Status | Borrower | Loan Amount |
|---|---|---|---|
| Open | Vasichek Shawn R | $140,850 |
Source: Public Records
Tax History Compared to Growth
Tax History
| Year | Tax Paid | Tax Assessment Tax Assessment Total Assessment is a certain percentage of the fair market value that is determined by local assessors to be the total taxable value of land and additions on the property. | Land | Improvement |
|---|---|---|---|---|
| 2024 | $4,037 | $147,750 | $35,350 | $112,400 |
| 2023 | $4,016 | $147,750 | $35,350 | $112,400 |
| 2022 | $3,716 | $134,300 | $35,350 | $98,950 |
| 2021 | $3,401 | $124,950 | $35,350 | $89,600 |
| 2020 | $3,357 | $124,950 | $35,350 | $89,600 |
| 2019 | $3,515 | $133,550 | $19,650 | $113,900 |
| 2018 | $3,469 | $133,550 | $19,650 | $113,900 |
| 2017 | $3,331 | $129,650 | $19,650 | $110,000 |
| 2016 | $2,966 | $125,850 | $19,650 | $106,200 |
| 2015 | $2,783 | $110,750 | $14,750 | $96,000 |
| 2014 | $2,596 | $100,700 | $14,750 | $85,950 |
| 2013 | $2,522 | $97,750 | $14,750 | $83,000 |
Source: Public Records
Map
Nearby Homes
- 403 11th Ave S Unit 2
- 344 9th Ave S
- 911 8th St S
- 1301 10th St S
- 820 10th St S Unit C20
- 1119 Elm St S
- 1020 9th Ave S
- 605 7th St S Unit 2
- 1112 Elm St S
- 1439 10th St S
- 1208 University Dr S
- 1112 University Dr S
- 1124 University Dr S
- 1425 11th St S
- 502 8th St S Unit 5
- 502 8th St S Unit 3
- 502 8th St S Unit 1
- 502 8th St S Unit 2
- 502 8th St S Unit 4
- 505 8th St S