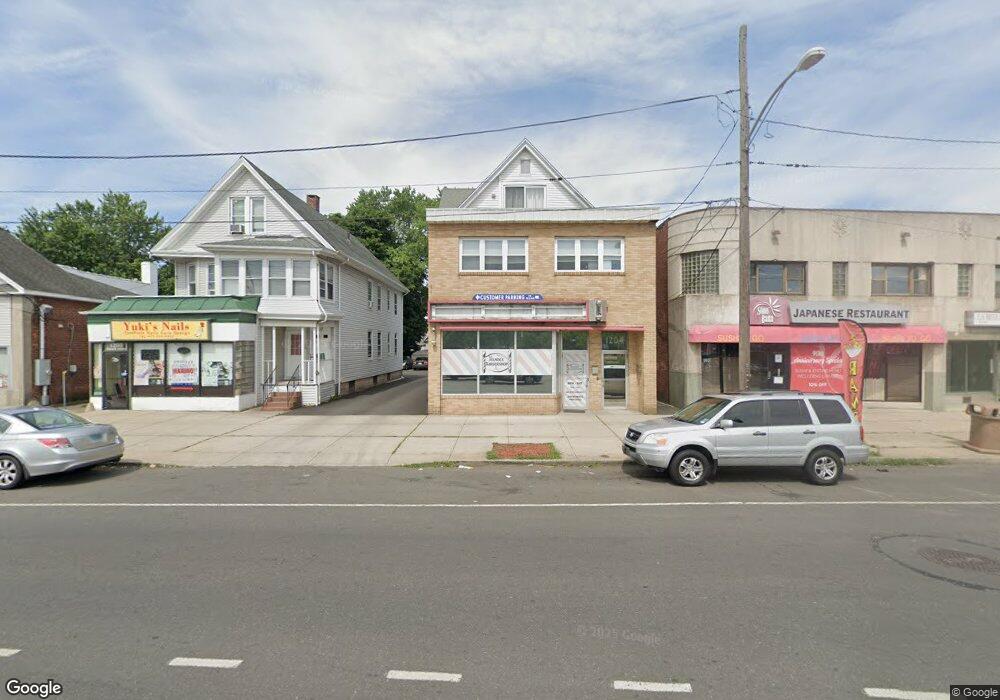
1202 Dixwell Ave Hamden, CT 06514
Estimated Value: $545,685
1
Bed
1
Bath
3,463
Sq Ft
$158/Sq Ft
Est. Value
About This Home
This home is located at 1202 Dixwell Ave, Hamden, CT 06514 and is currently estimated at $545,685, approximately $157 per square foot. 1202 Dixwell Ave is a home located in New Haven County with nearby schools including Church Street School, Hamden Middle School, and Hamden High School.
Ownership History
Date
Name
Owned For
Owner Type
Purchase Details
Closed on
Apr 12, 2023
Sold by
Glass Tarulus
Bought by
Nextproject360 Llc
Current Estimated Value
Home Financials for this Owner
Home Financials are based on the most recent Mortgage that was taken out on this home.
Original Mortgage
$427,121
Outstanding Balance
$414,580
Interest Rate
6.5%
Mortgage Type
FHA
Estimated Equity
$131,105
Purchase Details
Closed on
Apr 10, 2023
Sold by
Can-Al Llc
Bought by
Glass Tarulus
Home Financials for this Owner
Home Financials are based on the most recent Mortgage that was taken out on this home.
Original Mortgage
$427,121
Outstanding Balance
$414,580
Interest Rate
6.5%
Mortgage Type
FHA
Estimated Equity
$131,105
Create a Home Valuation Report for This Property
The Home Valuation Report is an in-depth analysis detailing your home's value as well as a comparison with similar homes in the area
Home Values in the Area
Average Home Value in this Area
Purchase History
| Date | Buyer | Sale Price | Title Company |
|---|---|---|---|
| Nextproject360 Llc | -- | None Available | |
| Glass Tarulus | $435,000 | None Available |
Source: Public Records
Mortgage History
| Date | Status | Borrower | Loan Amount |
|---|---|---|---|
| Open | Glass Tarulus | $427,121 |
Source: Public Records
Tax History
| Year | Tax Paid | Tax Assessment Tax Assessment Total Assessment is a certain percentage of the fair market value that is determined by local assessors to be the total taxable value of land and additions on the property. | Land | Improvement |
|---|---|---|---|---|
| 2025 | $16,270 | $313,600 | $102,550 | $211,050 |
| 2024 | $8,961 | $161,140 | $85,470 | $75,670 |
| 2023 | $9,085 | $161,140 | $85,470 | $75,670 |
| 2022 | $8,940 | $161,140 | $85,470 | $75,670 |
| 2021 | $8,450 | $161,140 | $85,470 | $75,670 |
| 2020 | $7,503 | $144,340 | $78,400 | $65,940 |
| 2019 | $7,052 | $144,340 | $78,400 | $65,940 |
| 2018 | $6,923 | $144,340 | $78,400 | $65,940 |
| 2017 | $6,533 | $144,340 | $78,400 | $65,940 |
| 2016 | $6,547 | $144,340 | $78,400 | $65,940 |
| 2015 | $5,513 | $134,890 | $78,400 | $56,490 |
| 2014 | $5,386 | $134,890 | $78,400 | $56,490 |
Source: Public Records
Map
Nearby Homes
- 1194 Dixwell Ave
- 1190 Dixwell Ave
- 4 Circular Ave
- 14 Helen St
- 41 Notkins St
- 37 Notkins St
- 31 Notkins St
- 18 Helen St
- 19 Notkins St
- 20 Circular Ave
- 15 Notkins St
- 1166 Dixwell Ave Unit 1166
- 1166 Dixwell Ave Unit 1158
- 1166 Dixwell Ave Unit 2
- 1166 Dixwell Ave
- 0 Circular Ave
- 1168 Dixwell Ave
- 44 Notkins St
- 40 Notkins St
- 11 Notkins St
Your Personal Tour Guide
Ask me questions while you tour the home.