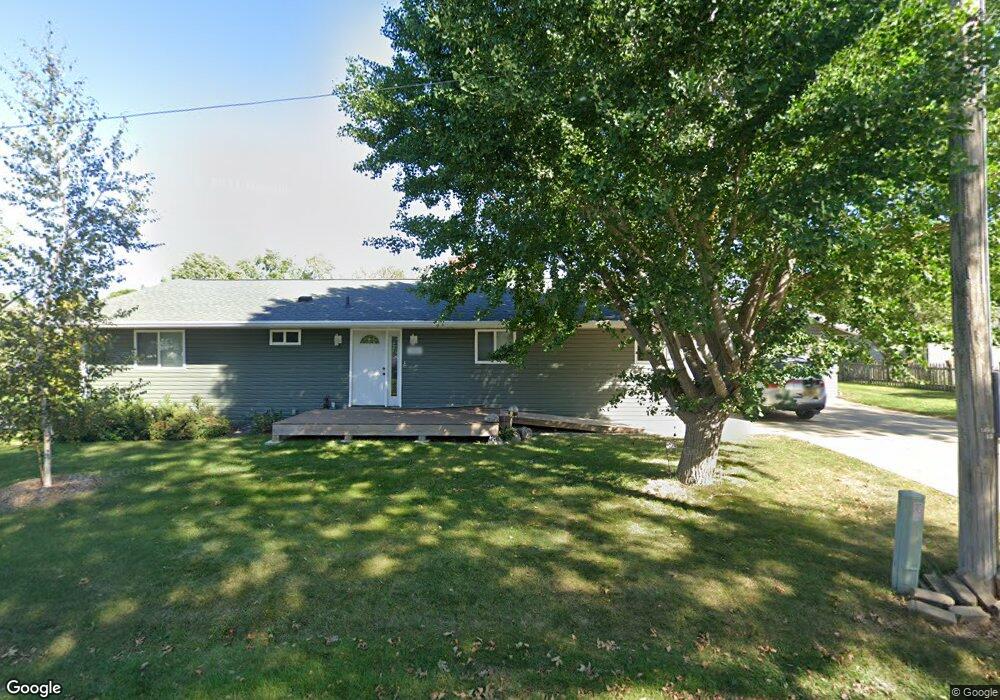
1202 E Ave Vinton, IA 52349
Estimated Value: $238,756 - $283,000
3
Beds
2
Baths
1,560
Sq Ft
$162/Sq Ft
Est. Value
About This Home
This home is located at 1202 E Ave, Vinton, IA 52349 and is currently estimated at $253,189, approximately $162 per square foot. 1202 E Ave is a home located in Benton County with nearby schools including Tilford Elementary School, Vinton-Shellsburg Middle School, and Vinton-Shellsburg High School.
Ownership History
Date
Name
Owned For
Owner Type
Purchase Details
Closed on
Jul 7, 2014
Sold by
Rollins Nancy E
Bought by
Still Bradley S and Still Christine A
Current Estimated Value
Home Financials for this Owner
Home Financials are based on the most recent Mortgage that was taken out on this home.
Original Mortgage
$116,000
Outstanding Balance
$88,191
Interest Rate
4.11%
Mortgage Type
New Conventional
Estimated Equity
$164,998
Create a Home Valuation Report for This Property
The Home Valuation Report is an in-depth analysis detailing your home's value as well as a comparison with similar homes in the area
Home Values in the Area
Average Home Value in this Area
Purchase History
| Date | Buyer | Sale Price | Title Company |
|---|---|---|---|
| Still Bradley S | $144,875 | None Available |
Source: Public Records
Mortgage History
| Date | Status | Borrower | Loan Amount |
|---|---|---|---|
| Open | Still Bradley S | $116,000 |
Source: Public Records
Tax History
| Year | Tax Paid | Tax Assessment Tax Assessment Total Assessment is a certain percentage of the fair market value that is determined by local assessors to be the total taxable value of land and additions on the property. | Land | Improvement |
|---|---|---|---|---|
| 2025 | $4,182 | $245,400 | $25,900 | $219,500 |
| 2024 | $4,182 | $223,200 | $25,900 | $197,300 |
| 2023 | $3,878 | $223,200 | $25,900 | $197,300 |
| 2022 | $3,980 | $180,200 | $20,700 | $159,500 |
| 2021 | $3,980 | $180,200 | $20,700 | $159,500 |
| 2020 | $3,000 | $138,600 | $17,700 | $120,900 |
| 2019 | $3,050 | $138,600 | $17,700 | $120,900 |
| 2018 | $2,962 | $139,100 | $16,700 | $122,400 |
| 2017 | $2,852 | $139,100 | $16,700 | $122,400 |
| 2016 | $2,806 | $130,000 | $15,600 | $114,400 |
| 2015 | $2,806 | $130,000 | $15,600 | $114,400 |
| 2014 | $2,968 | $137,300 | $0 | $0 |
Source: Public Records
Map
Nearby Homes
Your Personal Tour Guide
Ask me questions while you tour the home.