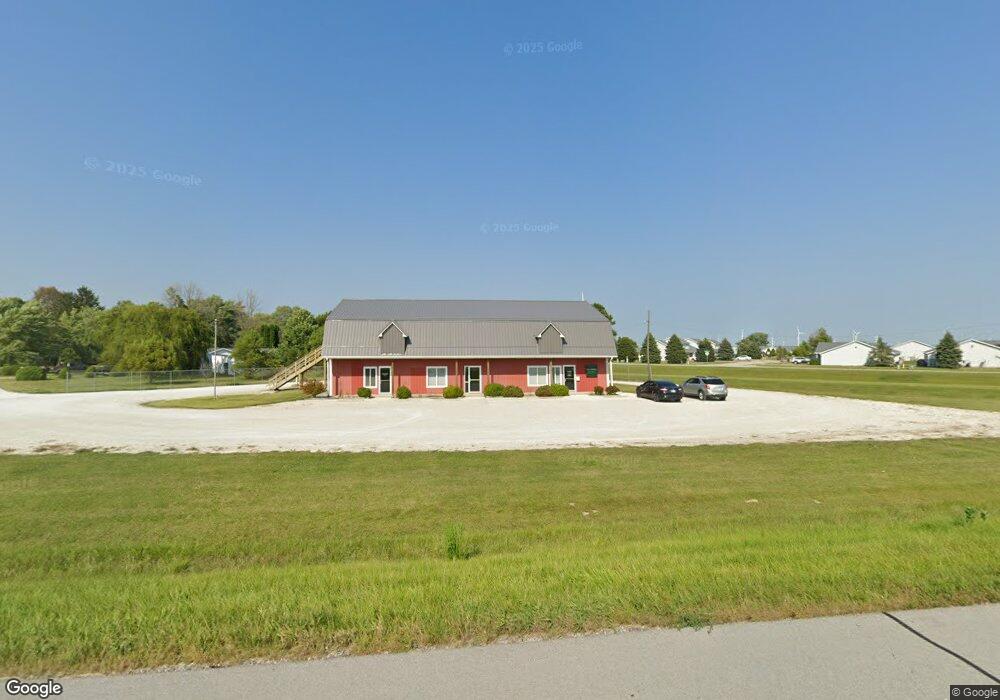
1202 E Lingle St Fowler, IN 47944
Studio
--
Bath
4,863
Sq Ft
1.14
Acres
About This Home
This home is located at 1202 E Lingle St, Fowler, IN 47944. 1202 E Lingle St is a home located in Benton County with nearby schools including Benton Central Junior/Senior High School and Sacred Heart Elementary School.
Ownership History
Date
Name
Owned For
Owner Type
Purchase Details
Closed on
May 3, 2022
Sold by
Swaney James B
Bought by
Johnson Matthew J and Johnson Sara E
Purchase Details
Closed on
Mar 21, 2019
Sold by
Lone Pine Enterprises Llc
Bought by
Swaney James B
Home Financials for this Owner
Home Financials are based on the most recent Mortgage that was taken out on this home.
Original Mortgage
$70,000
Interest Rate
4.3%
Mortgage Type
New Conventional
Create a Home Valuation Report for This Property
The Home Valuation Report is an in-depth analysis detailing your home's value as well as a comparison with similar homes in the area
Purchase History
| Date | Buyer | Sale Price | Title Company |
|---|---|---|---|
| Johnson Matthew J | -- | Howard S Gregory | |
| Swaney James B | -- | -- |
Source: Public Records
Mortgage History
| Date | Status | Borrower | Loan Amount |
|---|---|---|---|
| Previous Owner | Swaney James B | $70,000 |
Source: Public Records
Tax History Compared to Growth
Tax History
| Year | Tax Paid | Tax Assessment Tax Assessment Total Assessment is a certain percentage of the fair market value that is determined by local assessors to be the total taxable value of land and additions on the property. | Land | Improvement |
|---|---|---|---|---|
| 2024 | $2,902 | $105,000 | $32,800 | $72,200 |
| 2023 | $3,152 | $105,800 | $32,800 | $73,000 |
| 2022 | $2,992 | $95,000 | $32,800 | $62,200 |
| 2021 | $2,833 | $85,600 | $32,800 | $52,800 |
| 2020 | $2,605 | $82,700 | $32,800 | $49,900 |
| 2019 | $2,808 | $93,600 | $42,400 | $51,200 |
| 2018 | $2,808 | $93,600 | $42,400 | $51,200 |
| 2017 | $2,697 | $89,900 | $42,400 | $47,500 |
| 2016 | $2,544 | $84,800 | $42,400 | $42,400 |
| 2014 | $2,130 | $71,000 | $33,500 | $37,500 |
| 2013 | $2,130 | $72,100 | $32,600 | $39,500 |
Source: Public Records
Map
Nearby Homes
- 700 S Sharon Ave
- 1010 E 8th St
- 902 E 8th St
- 909 E 8th St
- 909 E 7th St
- 201 S Grant Ave
- 503 E 8th St
- 501 E 7th St
- 305 N Lincoln Ave
- 202 N Van Buren Ave
- 307 N Madison Ave
- 202 N Washington Ave
- 111 W 4th St
- 307 N Washington Ave
- 703 W 2nd St
- Lot 9 W 2nd St
- 665 W 2nd St
- Lot 12 W 2nd St
- Lot 10 W 2nd St
- 653 W 2nd St
- 1110 E Lingle St
- 1003 S Park Ave
- 1205 E Lingle St
- 1004 S James Ave
- 1302 E Lingle St
- 1001 S Park Ave
- 1204 E 14th St
- 1003 S James Ave
- 1002 S James Ave
- 1001 S James Ave
- 905 S Park Ave
- 1205 E 14th St
- 1207 E 14th St
- 1209 E 14th St
- 903 S James Ave
- 901 S Park Ave
- 1208 E 13th St
- 1106 S Shawn Ra Nae Dr
- 901 S James Ave
- 1004 S East St