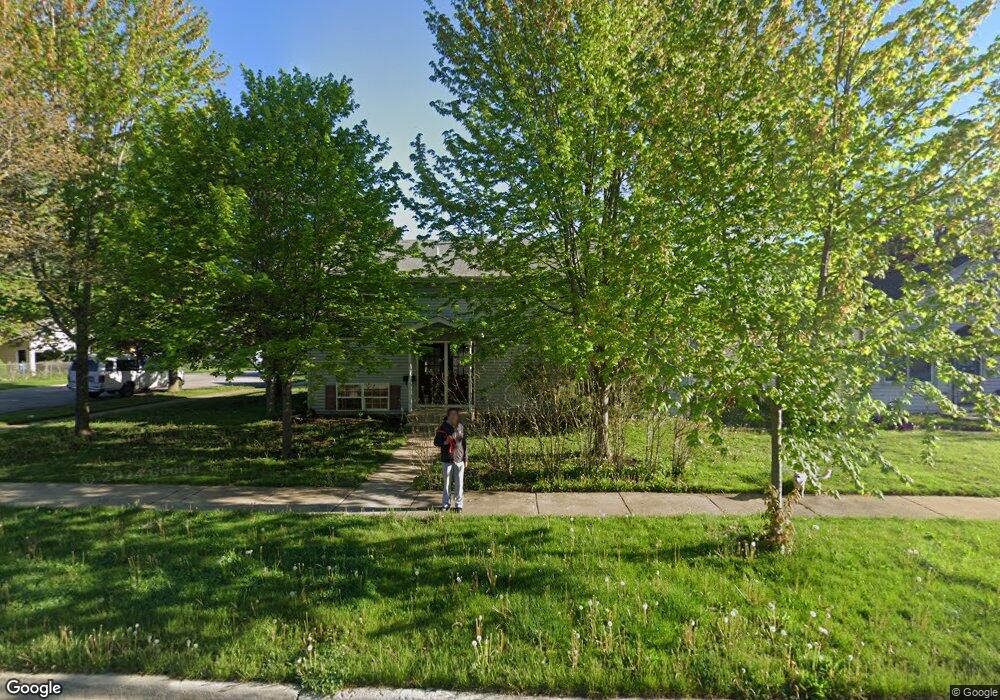
1202 Grove St Aurora, IL 60505
Light of the Community NeighborhoodEstimated Value: $304,000 - $371,000
5
Beds
3
Baths
2,184
Sq Ft
$154/Sq Ft
Est. Value
About This Home
This home is located at 1202 Grove St, Aurora, IL 60505 and is currently estimated at $336,652, approximately $154 per square foot. 1202 Grove St is a home located in Kane County with nearby schools including Oak Park Elementary School, Henry W Cowherd Middle School, and East Aurora High School.
Ownership History
Date
Name
Owned For
Owner Type
Purchase Details
Closed on
Jun 23, 2008
Sold by
Vargas Pedro
Bought by
Vargas Pedro and Vargas Ruben
Current Estimated Value
Home Financials for this Owner
Home Financials are based on the most recent Mortgage that was taken out on this home.
Original Mortgage
$207,000
Outstanding Balance
$135,986
Interest Rate
6.52%
Mortgage Type
New Conventional
Estimated Equity
$200,666
Purchase Details
Closed on
Aug 4, 2005
Sold by
Tovar Anastacio and Tovar Luz Maria
Bought by
Vargas Pedro
Home Financials for this Owner
Home Financials are based on the most recent Mortgage that was taken out on this home.
Original Mortgage
$159,120
Interest Rate
7.5%
Mortgage Type
Purchase Money Mortgage
Purchase Details
Closed on
Dec 2, 2003
Sold by
Arroyo Ruben
Bought by
Tovar Anastacio and Tovar Luz Maria
Purchase Details
Closed on
Aug 22, 2003
Sold by
Mendez Eduardo and Mendez Rita
Bought by
Arroyo Ruben
Create a Home Valuation Report for This Property
The Home Valuation Report is an in-depth analysis detailing your home's value as well as a comparison with similar homes in the area
Home Values in the Area
Average Home Value in this Area
Purchase History
| Date | Buyer | Sale Price | Title Company |
|---|---|---|---|
| Vargas Pedro | -- | Carrington Title Corp | |
| Vargas Pedro | $199,000 | Chicago Title Insurance Comp | |
| Tovar Anastacio | $27,000 | Multiple | |
| Arroyo Ruben | $14,000 | Multiple |
Source: Public Records
Mortgage History
| Date | Status | Borrower | Loan Amount |
|---|---|---|---|
| Open | Vargas Pedro | $207,000 | |
| Previous Owner | Vargas Pedro | $159,120 |
Source: Public Records
Tax History Compared to Growth
Tax History
| Year | Tax Paid | Tax Assessment Tax Assessment Total Assessment is a certain percentage of the fair market value that is determined by local assessors to be the total taxable value of land and additions on the property. | Land | Improvement |
|---|---|---|---|---|
| 2024 | $6,962 | $109,554 | $8,015 | $101,539 |
| 2023 | $6,515 | $95,185 | $7,161 | $88,024 |
| 2022 | $6,109 | $86,409 | $6,534 | $79,875 |
| 2021 | $6,318 | $84,267 | $6,083 | $78,184 |
| 2020 | $6,010 | $78,271 | $5,650 | $72,621 |
| 2019 | $6,641 | $81,361 | $5,235 | $76,126 |
| 2018 | $6,080 | $72,772 | $4,842 | $67,930 |
| 2017 | $5,578 | $62,876 | $4,461 | $58,415 |
| 2016 | $5,133 | $54,775 | $3,824 | $50,951 |
| 2015 | -- | $49,259 | $3,288 | $45,971 |
| 2014 | -- | $47,236 | $3,022 | $44,214 |
| 2013 | -- | $54,543 | $2,888 | $51,655 |
Source: Public Records
Map
Nearby Homes
- 1038 Liberty St
- 1105 Indian Ave
- 257 Vermont Ave
- 226 N Ohio St
- 1311 Kane St
- 1147 Rural St Unit 41
- 131 N Kendall St
- 172 N East Ave
- 608 Front St
- 15 Hill Ave
- 409 Dayward Ct
- 1900 E New York St
- 574 E Galena Blvd
- 1671 Sheffer Rd
- 0000 N Farnsworth Ave
- 773 Aurora Ave
- 610 Four Seasons Blvd Unit A071
- 1653 Victoria Park Cir Unit A183
- 1825 Bluestem Cir
- 1009 Assell Ave