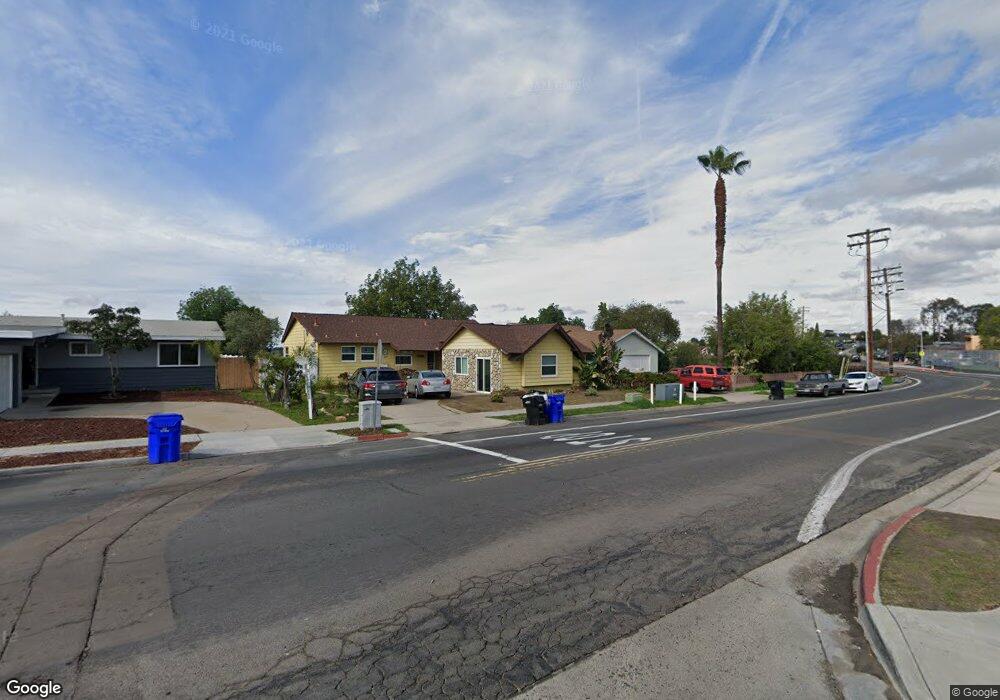
1202 Kelton Rd San Diego, CA 92114
Emerald Hills NeighborhoodEstimated Value: $690,000 - $814,000
3
Beds
2
Baths
1,681
Sq Ft
$447/Sq Ft
Est. Value
About This Home
This home is located at 1202 Kelton Rd, San Diego, CA 92114 and is currently estimated at $751,511, approximately $447 per square foot. 1202 Kelton Rd is a home located in San Diego County with nearby schools including Johnson Elementary School, Millennial Tech Middle School, and Lincoln High School.
Ownership History
Date
Name
Owned For
Owner Type
Purchase Details
Closed on
Jul 20, 2018
Sold by
Wilder Beverly Porter
Bought by
Wilder Wilder R and Wilder Beverly Porter
Current Estimated Value
Purchase Details
Closed on
Aug 23, 2017
Sold by
Porter Winifred J and The Winifred J Porter Trust
Bought by
Wilder Beverly Porter
Purchase Details
Closed on
Oct 2, 2014
Sold by
Proter Winifred J
Bought by
Porter Winifred J
Purchase Details
Closed on
Jun 11, 2001
Sold by
Thomas Ernest William
Bought by
Thomas Marion D
Purchase Details
Closed on
Apr 6, 2001
Sold by
Wilder R B and Payne Luella
Bought by
Porter Winifred J
Purchase Details
Closed on
Jul 26, 1995
Sold by
Wilder Brown Grace
Bought by
Wilder Billy Charles
Purchase Details
Closed on
May 26, 1995
Sold by
Wilder Billy Charles
Bought by
Wilder R B and Payne Luella
Create a Home Valuation Report for This Property
The Home Valuation Report is an in-depth analysis detailing your home's value as well as a comparison with similar homes in the area
Home Values in the Area
Average Home Value in this Area
Purchase History
| Date | Buyer | Sale Price | Title Company |
|---|---|---|---|
| Wilder Wilder R | -- | None Available | |
| Wilder Beverly Porter | -- | None Available | |
| Porter Winifred J | -- | None Available | |
| Thomas Marion D | -- | First American Title Ins Co | |
| Porter Winifred J | $75,000 | First American Title Ins Co | |
| Wilder Billy Charles | -- | -- | |
| Wilder R B | -- | -- |
Source: Public Records
Tax History Compared to Growth
Tax History
| Year | Tax Paid | Tax Assessment Tax Assessment Total Assessment is a certain percentage of the fair market value that is determined by local assessors to be the total taxable value of land and additions on the property. | Land | Improvement |
|---|---|---|---|---|
| 2025 | $4,001 | $335,430 | $127,085 | $208,345 |
| 2024 | $4,001 | $328,854 | $124,594 | $204,260 |
| 2023 | $3,910 | $322,406 | $122,151 | $200,255 |
| 2022 | $3,804 | $316,085 | $119,756 | $196,329 |
| 2021 | $3,776 | $309,888 | $117,408 | $192,480 |
| 2020 | $3,730 | $306,712 | $116,205 | $190,507 |
| 2019 | $3,662 | $300,699 | $113,927 | $186,772 |
| 2018 | $3,424 | $294,804 | $111,694 | $183,110 |
| 2017 | $3,422 | $289,024 | $109,504 | $179,520 |
| 2016 | $3,367 | $283,357 | $107,357 | $176,000 |
| 2015 | $3,318 | $279,102 | $105,745 | $173,357 |
| 2014 | $2,794 | $233,541 | $79,894 | $153,647 |
Source: Public Records
Map
Nearby Homes
- 5823 Roswell St
- 5612 Zircon St
- 5863 Roswell St
- 962 Hanover St
- 5454 Roswell St
- 5469 Roswell St
- 1825 Bayview Heights Dr Unit 97
- 6017 Broadway
- 1651 Pentecost Way Unit 1
- 1653 Pentecost Way Unit 12
- 1647 Pentecost Way Unit 11
- 1679 Pentecost Way Unit 5
- 525 Pitta St
- 5989 Chaumont Dr
- 0 Weaver St
- 6117 Brooklyn Ave
- 5050 A St Unit 11
- 5318 Naranja St
- 5282 Naranja St
- 5282 Naranja St Unit 3