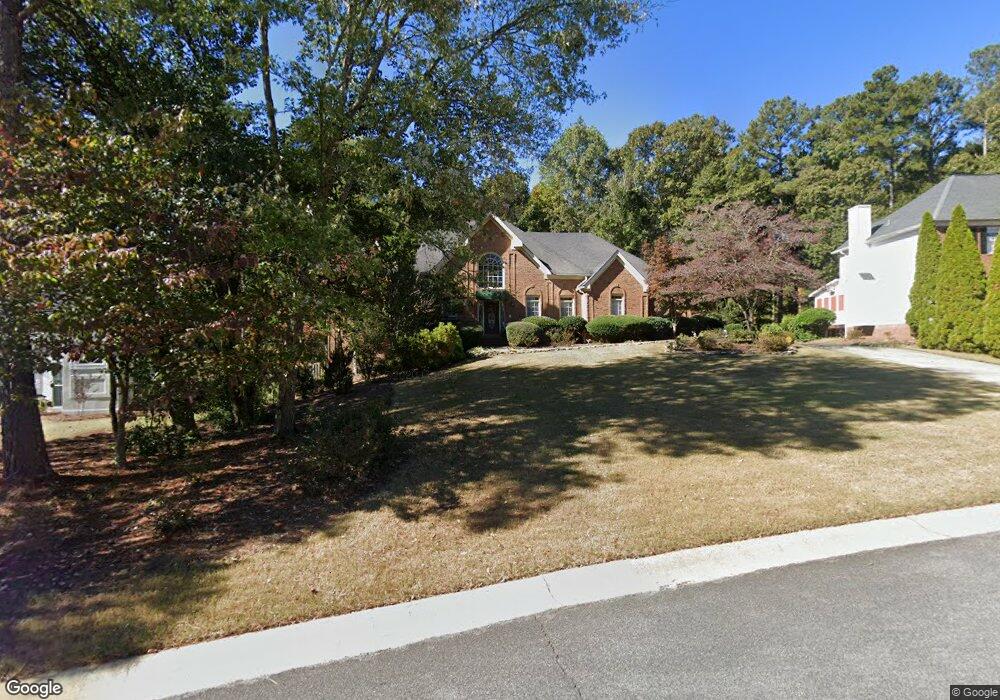
1202 Larson Ln SW Unit 1 Marietta, GA 30064
West Cobb NeighborhoodEstimated Value: $602,000 - $694,000
4
Beds
3
Baths
3,520
Sq Ft
$181/Sq Ft
Est. Value
About This Home
This home is located at 1202 Larson Ln SW Unit 1, Marietta, GA 30064 and is currently estimated at $637,288, approximately $181 per square foot. 1202 Larson Ln SW Unit 1 is a home located in Cobb County with nearby schools including Cheatham Hill Elementary School, Lovinggood Middle School, and Hillgrove High School.
Ownership History
Date
Name
Owned For
Owner Type
Purchase Details
Closed on
Feb 22, 2017
Sold by
Davis James
Bought by
Thomas Vickie Lynn
Current Estimated Value
Purchase Details
Closed on
Mar 27, 2011
Sold by
Thomas Vickie
Bought by
Davis James and Davis Vickie T
Purchase Details
Closed on
Feb 16, 2001
Sold by
Thomas Juanita
Bought by
Thomas Vickie
Home Financials for this Owner
Home Financials are based on the most recent Mortgage that was taken out on this home.
Original Mortgage
$275,000
Interest Rate
7.06%
Mortgage Type
New Conventional
Purchase Details
Closed on
Sep 30, 1999
Sold by
Carman John S
Bought by
Thomas Vickie and Thomas Juanita
Home Financials for this Owner
Home Financials are based on the most recent Mortgage that was taken out on this home.
Original Mortgage
$261,250
Interest Rate
7.91%
Mortgage Type
New Conventional
Create a Home Valuation Report for This Property
The Home Valuation Report is an in-depth analysis detailing your home's value as well as a comparison with similar homes in the area
Home Values in the Area
Average Home Value in this Area
Purchase History
| Date | Buyer | Sale Price | Title Company |
|---|---|---|---|
| Thomas Vickie Lynn | -- | -- | |
| Davis James | -- | -- | |
| Thomas Vickie | -- | -- | |
| Thomas Vickie | $275,000 | -- |
Source: Public Records
Mortgage History
| Date | Status | Borrower | Loan Amount |
|---|---|---|---|
| Previous Owner | Thomas Vickie | $275,000 | |
| Previous Owner | Thomas Vickie | $261,250 |
Source: Public Records
Tax History Compared to Growth
Tax History
| Year | Tax Paid | Tax Assessment Tax Assessment Total Assessment is a certain percentage of the fair market value that is determined by local assessors to be the total taxable value of land and additions on the property. | Land | Improvement |
|---|---|---|---|---|
| 2025 | $1,278 | $217,648 | $52,000 | $165,648 |
| 2024 | $1,282 | $217,648 | $52,000 | $165,648 |
| 2023 | $4,496 | $222,172 | $44,000 | $178,172 |
| 2022 | $5,079 | $222,172 | $44,000 | $178,172 |
| 2021 | $3,982 | $172,052 | $28,000 | $144,052 |
| 2020 | $4,058 | $175,536 | $28,000 | $147,536 |
| 2019 | $4,058 | $175,536 | $28,000 | $147,536 |
| 2018 | $3,776 | $162,620 | $28,000 | $134,620 |
| 2017 | $1,141 | $162,620 | $28,000 | $134,620 |
| 2016 | $1,051 | $132,232 | $32,300 | $99,932 |
| 2015 | $1,127 | $132,232 | $32,300 | $99,932 |
| 2014 | $1,153 | $132,232 | $0 | $0 |
Source: Public Records
Map
Nearby Homes
- 1200 Larson Ln SW
- 1500 Larson Way SW Unit 2
- 1496 Sweet Bottom Cir SW
- 1463 Bailey Farm Dr SW
- 1537 Mcadoo Dr SW
- 1126 Wedgefield Dr SW
- 1950 Mcadoo Ct SW
- 1533 Fallen Leaf Dr SW
- 1114 Wind Hill Ln SW
- 1400 Mcquiston Ct SW
- 994 Gentry Ln SW
- 1799 Hammond Woods Cir SW
- 1271 Channel Park SW
- 987 Kora Dr
- 1589 Hammond Woods Cir SW
- 1204 Larson Ln SW Unit 2
- 1204 Larson Ln SW
- 1188 Ward Creek Dr SW Unit 1
- 1201 Larson Ln SW
- 1191 Ward Creek Dr SW
- 1199 Larson Ln SW
- 1193 Ward Creek Dr SW
- 1189 Ward Creek Dr SW
- 0 Cheatham Hill Rd Unit 8896131
- 0 Cheatham Hill Rd Unit 8602605
- 0 Cheatham Hill Rd Unit 8831812
- 0 Cheatham Hill Rd Unit 8421030
- 0 Cheatham Hill Rd Unit 8232405
- 0 Cheatham Hill Rd Unit 8585581
- 0 Cheatham Hill Rd Unit 8506877
- 0 Cheatham Hill Rd Unit 7506546
- 0 Cheatham Hill Rd
- 1196 Larson Ln SW
- 1182 Ward Creek Dr SW
- 1197 Larson Ln SW