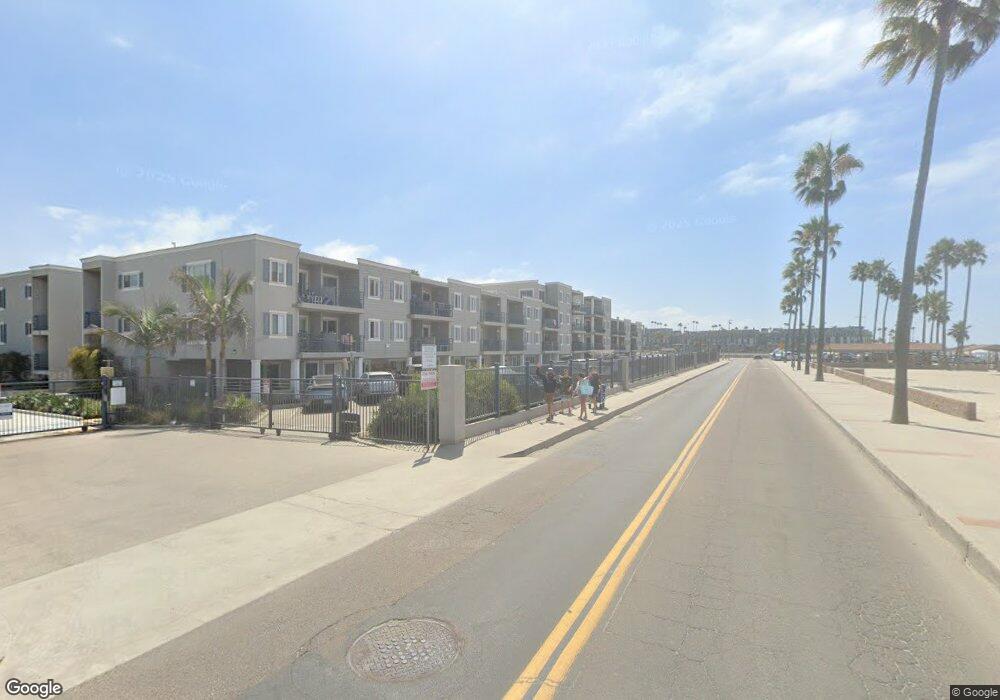
Marina Del Mar 1202 N Pacific St Unit 308A Oceanside, CA 92054
Downtown Oceanside NeighborhoodEstimated Value: $805,776 - $842,000
1
Bed
1
Bath
619
Sq Ft
$1,327/Sq Ft
Est. Value
About This Home
This home is located at 1202 N Pacific St Unit 308A, Oceanside, CA 92054 and is currently estimated at $821,694, approximately $1,327 per square foot. 1202 N Pacific St Unit 308A is a home located in San Diego County with nearby schools including Laurel Elementary School, Oceanside High School, and St. Mary Star Of The Sea Elementary School.
Ownership History
Date
Name
Owned For
Owner Type
Purchase Details
Closed on
Jul 31, 2024
Sold by
Underdahl Family Trust and Underdahl Kevin C
Bought by
Aguilo Jonathan Buya and Elazegui Lisa Marie
Current Estimated Value
Home Financials for this Owner
Home Financials are based on the most recent Mortgage that was taken out on this home.
Original Mortgage
$542,500
Outstanding Balance
$536,455
Interest Rate
6.95%
Mortgage Type
New Conventional
Estimated Equity
$285,239
Purchase Details
Closed on
Mar 20, 2023
Sold by
Catherine Panopoulos Family Trust
Bought by
Roughan Catherine Rebecca
Purchase Details
Closed on
Dec 12, 2014
Sold by
Panopoulos Catherine Rebecca
Bought by
Panopoulos Catherine R and Catherine R Panopoulos Family
Purchase Details
Closed on
Aug 31, 1993
Sold by
Fox William E and Fox Beverly J
Bought by
Fox William E and Fox Beverly J
Create a Home Valuation Report for This Property
The Home Valuation Report is an in-depth analysis detailing your home's value as well as a comparison with similar homes in the area
Home Values in the Area
Average Home Value in this Area
Purchase History
| Date | Buyer | Sale Price | Title Company |
|---|---|---|---|
| Aguilo Jonathan Buya | $775,000 | Ticor Title | |
| Roughan Catherine Rebecca | -- | Fidelity National Title | |
| Panopoulos Catherine R | -- | None Available | |
| Fox William E | -- | -- |
Source: Public Records
Mortgage History
| Date | Status | Borrower | Loan Amount |
|---|---|---|---|
| Open | Aguilo Jonathan Buya | $542,500 |
Source: Public Records
Tax History Compared to Growth
Tax History
| Year | Tax Paid | Tax Assessment Tax Assessment Total Assessment is a certain percentage of the fair market value that is determined by local assessors to be the total taxable value of land and additions on the property. | Land | Improvement |
|---|---|---|---|---|
| 2025 | $3,747 | $800,400 | $600,400 | $200,000 |
| 2024 | $3,747 | $916,979 | $674,547 | $242,432 |
| 2023 | $3,747 | $331,162 | $243,609 | $87,553 |
| 2022 | $3,690 | $331,162 | $243,609 | $87,553 |
| 2021 | $3,705 | $324,670 | $238,833 | $85,837 |
| 2020 | $3,590 | $321,342 | $236,385 | $84,957 |
| 2019 | $3,485 | $315,042 | $231,750 | $83,292 |
| 2018 | $3,449 | $308,865 | $227,206 | $81,659 |
| 2017 | $3,386 | $302,809 | $222,751 | $80,058 |
| 2016 | $3,277 | $296,873 | $218,384 | $78,489 |
| 2015 | $3,105 | $292,415 | $215,104 | $77,311 |
| 2014 | $2,983 | $286,688 | $210,891 | $75,797 |
Source: Public Records
About Marina Del Mar
Map
Nearby Homes
- 1202 N Pacific St Unit 307A
- 1202 N Pacific St Unit 204A
- 1202 N Pacific St Unit 402A
- 1202 N Pacific St Unit 101B
- 999 N Pacific St Unit G321
- 999 N Pacific St Unit F101
- 999 N Pacific St Unit C201
- 999 N Pacific St Unit B108
- 999 N Pacific St Unit G309
- 999 N Pacific St Unit G316
- 999 N Pacific St Unit F13
- 999 N Pacific St Unit B209
- 999 N Pacific St Unit D-011
- 1200 Harbor Dr N Unit 16B
- 1200 Harbor Dr N Unit 15B
- 1200 Harbor Dr N Unit 9A
- 1019 Costa Pacifica Way Unit 1210
- 900 N Cleveland St Unit 113
- 900 N Cleveland St Unit 103
- 912 Mira Mar Place
- 1202 N Pacific St
- 1202 N Pacific St Unit B-310
- 1202 N Pacific St
- 1202 N Pacific St
- 1202 N Pacific St
- 1202 N Pacific St Unit 204B
- 1202 N Pacific St Unit 207-A
- 1202 N Pacific St Unit 102B
- 1202 N Pacific St Unit A214
- 1202 N Pacific St Unit 102B
- 1202 N Pacific St Unit 101 B
- 1202 N Pacific St Unit 210B
- 1202 N Pacific St Unit 201B
- 1202 N Pacific St Unit 206B
- 1202 N Pacific St Unit 213A
- 1202 N Pacific St Unit 104B
- 1202 N Pacific St Unit 213B
- 1202 N Pacific St Unit 302-B
- 1202 N Pacific St Unit B303
- 1202 N Pacific St Unit A401