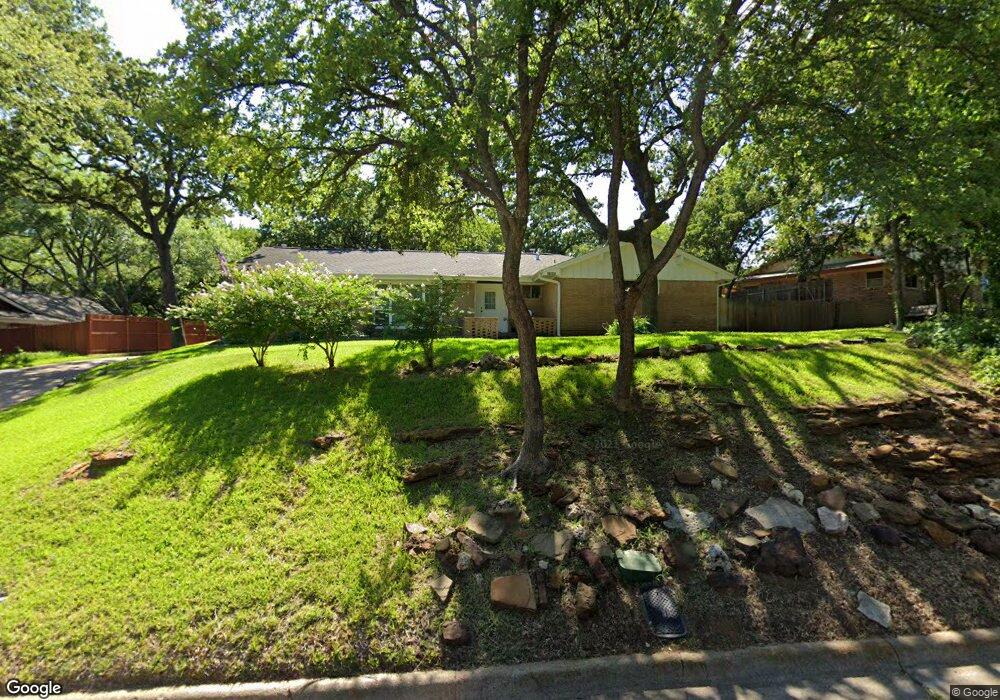
1202 Pebble Creek Dr Euless, TX 76040
Estimated Value: $424,000 - $594,000
4
Beds
3
Baths
2,585
Sq Ft
$188/Sq Ft
Est. Value
About This Home
This home is located at 1202 Pebble Creek Dr, Euless, TX 76040 and is currently estimated at $485,470, approximately $187 per square foot. 1202 Pebble Creek Dr is a home located in Tarrant County with nearby schools including Stonegate Elementary School, Central J High School, and L.D. Bell High School.
Ownership History
Date
Name
Owned For
Owner Type
Purchase Details
Closed on
Jun 2, 2025
Sold by
Davidson Bradford Louis and Davidson Bradford
Bought by
Davidson Bradford Louis and Davidson Dixie L
Current Estimated Value
Purchase Details
Closed on
May 13, 2011
Sold by
Bruns Melinda
Bought by
Davidson Bradford and Davidson Dixie
Purchase Details
Closed on
Dec 7, 2010
Sold by
Estate Of Sybil Ruth Baldwin
Bought by
Bruns Melinda
Purchase Details
Closed on
Aug 14, 2004
Sold by
Martin Robert
Bought by
Baldwin Sybil
Purchase Details
Closed on
Jul 22, 2004
Sold by
Martin Derek
Bought by
Baldwin Sybil
Purchase Details
Closed on
Jun 28, 2004
Sold by
Baldwin Rhett Douglas
Bought by
Baldwin Sybil
Purchase Details
Closed on
Jun 25, 2004
Sold by
Adams Jodi C Baldwin
Bought by
Baldwin Sybil
Create a Home Valuation Report for This Property
The Home Valuation Report is an in-depth analysis detailing your home's value as well as a comparison with similar homes in the area
Home Values in the Area
Average Home Value in this Area
Purchase History
| Date | Buyer | Sale Price | Title Company |
|---|---|---|---|
| Davidson Bradford Louis | -- | None Listed On Document | |
| Davidson Dixie | -- | None Listed On Document | |
| Davidson Bradford | -- | Fatco | |
| Bruns Melinda | -- | None Available | |
| Baldwin Sybil | -- | -- | |
| Baldwin Sybil | -- | -- | |
| Baldwin Sybil | -- | -- | |
| Baldwin Sybil | -- | -- | |
| Baldwin Sybil | -- | -- |
Source: Public Records
Tax History Compared to Growth
Tax History
| Year | Tax Paid | Tax Assessment Tax Assessment Total Assessment is a certain percentage of the fair market value that is determined by local assessors to be the total taxable value of land and additions on the property. | Land | Improvement |
|---|---|---|---|---|
| 2025 | $1,239 | $329,000 | $90,000 | $239,000 |
| 2024 | $1,239 | $329,000 | $90,000 | $239,000 |
| 2023 | $5,904 | $379,425 | $70,000 | $309,425 |
| 2022 | $6,134 | $285,532 | $70,000 | $215,532 |
| 2021 | $6,136 | $273,000 | $70,000 | $203,000 |
| 2020 | $5,633 | $248,037 | $70,000 | $178,037 |
| 2019 | $5,639 | $249,363 | $70,000 | $179,363 |
| 2018 | $2,716 | $220,000 | $40,000 | $180,000 |
| 2017 | $5,102 | $220,000 | $40,000 | $180,000 |
| 2016 | $4,638 | $197,158 | $40,000 | $157,158 |
| 2015 | $2,736 | $175,300 | $25,500 | $149,800 |
| 2014 | $2,736 | $175,300 | $25,500 | $149,800 |
Source: Public Records
Map
Nearby Homes
- 1200 Tanglewood Trail
- 1309 Driftwood Dr
- 1302 Woodridge Cir
- 832 Chateau Valee Cir
- 1407 Woodridge Cir
- 1501 Woodridge Cir
- 720 Tanglewood Dr
- 716 E Pecan St Unit 716 - 722
- 704 Tanglewood Dr
- 3905 Shady Creek Dr
- 712 Brookfield Dr
- 909 Overhill Dr
- 904 Nelson Terrace
- 933 Wade Dr
- 849 Russell Ln
- 921 Overhill Dr
- 1004 Overhill Dr
- 1031 Boston Blvd
- 1108 Wade Dr
- 803 Glenda Dr
- 1200 Pebble Creek Dr
- 1204 Pebble Creek Dr
- 1205 Driftwood Dr
- 1203 Driftwood Dr
- 1206 Pebble Creek Dr
- 4101 Pebble Creek Dr
- 1203 Pebble Creek Dr
- 1207 Driftwood Dr
- 1205 Pebble Creek Dr
- 1201 Pebble Creek Dr
- 1201 Driftwood Dr
- 1207 Pebble Creek Dr
- 1208 Pebble Creek Dr
- 4100 Pebble Creek Dr
- 4103 Pebble Creek Dr
- 1204 Driftwood Dr
- 1209 Driftwood Dr
- 1107 Penoak Ct
- 1202 Driftwood Dr
- 1107 Driftwood Dr