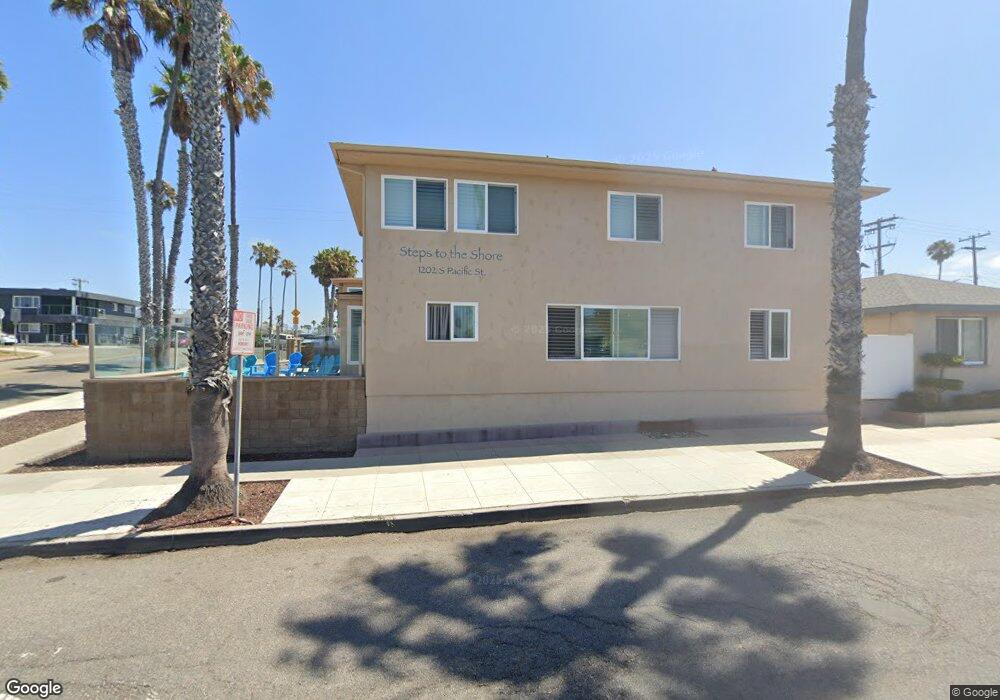
1202 S Pacific St Unit 314B Oceanside, CA 92054
Downtown Oceanside NeighborhoodEstimated Value: $683,457 - $755,000
1
Bed
1
Bath
623
Sq Ft
$1,163/Sq Ft
Est. Value
About This Home
This home is located at 1202 S Pacific St Unit 314B, Oceanside, CA 92054 and is currently estimated at $724,614, approximately $1,163 per square foot. 1202 S Pacific St Unit 314B is a home located in San Diego County with nearby schools including South Oceanside Elementary School, Lincoln Middle School, and Oceanside High School.
Ownership History
Date
Name
Owned For
Owner Type
Purchase Details
Closed on
Oct 20, 2010
Sold by
Butler Karin Janet and Charles & Karin Butler 2002 Tr
Bought by
Yahisian Margarit and Galifada Family Trust
Current Estimated Value
Purchase Details
Closed on
Jun 4, 2002
Sold by
Butler Charles E and Butler Karin Janet
Bought by
Butler Charles E and Butler Karin Janet
Purchase Details
Closed on
Nov 17, 1999
Sold by
Crossen Bert W
Bought by
Butler Charles E and Butler Karin Janet
Home Financials for this Owner
Home Financials are based on the most recent Mortgage that was taken out on this home.
Original Mortgage
$123,200
Interest Rate
7.25%
Purchase Details
Closed on
Jun 1, 1998
Sold by
Prestiminzi Joseph and Prestiminzi Rose Marie
Bought by
Crossen Bert Wells
Purchase Details
Closed on
Jun 25, 1996
Sold by
Hurtado Gilbert and Hurtado Cheryl
Bought by
Prestininzi Joseph and Prestininzi Rose Marie
Purchase Details
Closed on
Jul 26, 1991
Create a Home Valuation Report for This Property
The Home Valuation Report is an in-depth analysis detailing your home's value as well as a comparison with similar homes in the area
Home Values in the Area
Average Home Value in this Area
Purchase History
| Date | Buyer | Sale Price | Title Company |
|---|---|---|---|
| Yahisian Margarit | $290,000 | Chicago Title Company | |
| Butler Charles E | -- | -- | |
| Butler Charles E | $154,000 | Commonwealth Land Title Co | |
| Crossen Bert Wells | $120,000 | Commonwealth Land Title Co | |
| Prestininzi Joseph | -- | Fidelity National Title Ins | |
| -- | $105,000 | -- |
Source: Public Records
Mortgage History
| Date | Status | Borrower | Loan Amount |
|---|---|---|---|
| Previous Owner | Butler Charles E | $123,200 |
Source: Public Records
Tax History Compared to Growth
Tax History
| Year | Tax Paid | Tax Assessment Tax Assessment Total Assessment is a certain percentage of the fair market value that is determined by local assessors to be the total taxable value of land and additions on the property. | Land | Improvement |
|---|---|---|---|---|
| 2025 | $4,143 | $388,695 | $240,087 | $148,608 |
| 2024 | $4,143 | $381,075 | $235,380 | $145,695 |
| 2023 | $4,143 | $373,604 | $230,765 | $142,839 |
| 2022 | $4,080 | $366,280 | $226,241 | $140,039 |
| 2021 | $4,096 | $359,099 | $221,805 | $137,294 |
| 2020 | $3,969 | $355,418 | $219,531 | $135,887 |
| 2019 | $3,854 | $348,450 | $215,227 | $133,223 |
| 2018 | $3,813 | $341,618 | $211,007 | $130,611 |
| 2017 | $3,743 | $334,920 | $206,870 | $128,050 |
| 2016 | $3,623 | $328,354 | $202,814 | $125,540 |
| 2015 | $3,517 | $323,423 | $199,768 | $123,655 |
| 2014 | $3,380 | $317,088 | $195,855 | $121,233 |
Source: Public Records
Map
Nearby Homes
- 1216 S Pacific St
- 1123-25 S Pacific St
- 1102 S Pacific St
- 1324 S Pacific St Unit 4
- 1409 S Pacific St
- 834 S Pacific St
- 1009 S Coast Hwy
- 1445 S Pacific St
- 120 Sherri Ln
- 1570 Vista Del Mar Way Unit 4
- 1573 Vista Del Mar Way
- 605 S Myers St Unit 1
- 909 Leonard Ave
- 519 S Myers St
- 516 S The Strand
- 514 S Myers St
- 35 Parkwood Ln
- 465 S Cleveland St Unit 103
- 1743 S Tremont St
- 1121 Makena Way
- 1202 S Pacific St Unit 312-B
- 1202 S Pacific St Unit A401
- 1202 S Pacific St Unit A214
- 1202 S Pacific St
- 1212 S Pacific St
- 110 Oceanside Blvd
- 110 Oceanside Blvd Unit C
- 201 Oceanside Blvd
- 201 El Camino
- 201 El Camino
- 1203 S Pacific St Unit B
- 1203 S Pacific St Unit A
- 1218 S Pacific St
- 1205 S Pacific St Unit B
- 1205 S Pacific St Unit 2
- 1205 S Pacific St Unit 1
- 100 Oceanside Blvd
- 1201 S Pacific St Unit B
- 1201 S Pacific St Unit A
- 1210 Tait St