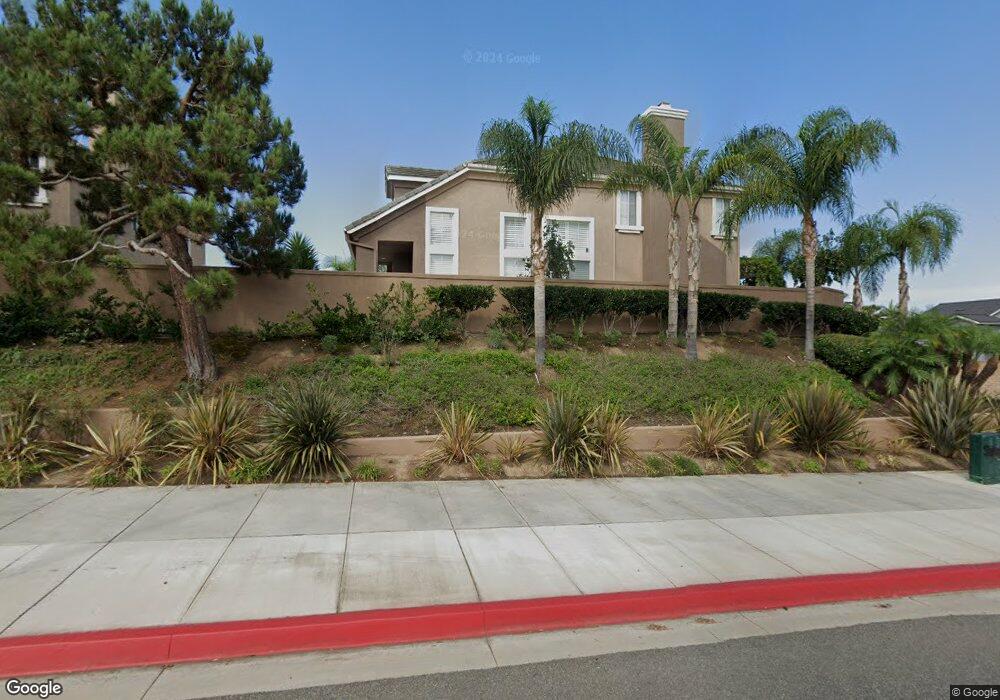
1202 Summerview Ln Huntington Beach, CA 92648
Estimated Value: $1,457,617 - $1,806,000
3
Beds
3
Baths
2,043
Sq Ft
$763/Sq Ft
Est. Value
About This Home
This home is located at 1202 Summerview Ln, Huntington Beach, CA 92648 and is currently estimated at $1,559,154, approximately $763 per square foot. 1202 Summerview Ln is a home located in Orange County with nearby schools including John R. Peterson Elementary, Ethel Dwyer Middle, and Huntington Beach High School.
Ownership History
Date
Name
Owned For
Owner Type
Purchase Details
Closed on
Feb 21, 2020
Sold by
Hoang Andrew and Tran Mai Bich
Bought by
Le Son Minh and Le Thuy Thi
Current Estimated Value
Purchase Details
Closed on
Apr 20, 2006
Sold by
Lin Shawn Hsien Fan and Hoang Loni L
Bought by
Hoang Andrew and Tran Mai Bich
Home Financials for this Owner
Home Financials are based on the most recent Mortgage that was taken out on this home.
Original Mortgage
$200,000
Interest Rate
6.29%
Mortgage Type
Fannie Mae Freddie Mac
Purchase Details
Closed on
Nov 20, 1995
Sold by
Greystone Homes Inc
Bought by
Hoang Andrew and Tran Mai Bich
Home Financials for this Owner
Home Financials are based on the most recent Mortgage that was taken out on this home.
Original Mortgage
$70,000
Interest Rate
7.48%
Create a Home Valuation Report for This Property
The Home Valuation Report is an in-depth analysis detailing your home's value as well as a comparison with similar homes in the area
Home Values in the Area
Average Home Value in this Area
Purchase History
| Date | Buyer | Sale Price | Title Company |
|---|---|---|---|
| Le Son Minh | $941,000 | Landwood Title Company | |
| Hoang Andrew | $403,000 | First American Title Co | |
| Lin Shawn Hsien Fan | -- | First American Title Co | |
| Hoang Andrew | $267,000 | First American Title Ins |
Source: Public Records
Mortgage History
| Date | Status | Borrower | Loan Amount |
|---|---|---|---|
| Previous Owner | Hoang Andrew | $200,000 | |
| Previous Owner | Hoang Andrew | $70,000 |
Source: Public Records
Tax History Compared to Growth
Tax History
| Year | Tax Paid | Tax Assessment Tax Assessment Total Assessment is a certain percentage of the fair market value that is determined by local assessors to be the total taxable value of land and additions on the property. | Land | Improvement |
|---|---|---|---|---|
| 2025 | $11,516 | $1,029,118 | $742,259 | $286,859 |
| 2024 | $11,516 | $1,008,940 | $727,705 | $281,235 |
| 2023 | $11,261 | $989,157 | $713,436 | $275,721 |
| 2022 | $10,967 | $969,762 | $699,447 | $270,315 |
| 2021 | $10,763 | $950,748 | $685,733 | $265,015 |
| 2020 | $6,927 | $598,029 | $308,444 | $289,585 |
| 2019 | $6,845 | $586,303 | $302,396 | $283,907 |
| 2018 | $6,740 | $574,807 | $296,466 | $278,341 |
| 2017 | $6,651 | $563,537 | $290,653 | $272,884 |
| 2016 | $6,358 | $552,488 | $284,954 | $267,534 |
| 2015 | $6,297 | $544,190 | $280,674 | $263,516 |
| 2014 | $6,166 | $533,531 | $275,176 | $258,355 |
Source: Public Records
Map
Nearby Homes
- 20301 Bluffside Cir Unit D401
- 20301 Bluffside Cir Unit D312
- 20331 Bluffside Cir Unit 411
- 20331 Bluffside Cir Unit A108
- 20331 Bluffside Cir Unit 222
- 20331 Bluffside Cir Unit A320
- 20331 Bluffside Cir Unit 417
- 20251 Cape Coral Ln Unit 315
- 1015 Georgia St
- 20371 Bluffside Cir Unit B214
- 8122 Seawater Dr
- 609 Amber Dr
- 20401 Somerville Ln
- 1425 Alpine Ln
- 8182 Mainsail Dr Unit 203
- 1208 California St
- 1017 Delaware St
- 20302 Tidepool Cir Unit 204
- 632 Indianapolis Ave
- 344 Portland Cir Unit 342
- 791 Seadrift Dr
- 1192 Summerview Ln
- 781 Seadrift Dr
- 1182 Summerview Ln
- 771 Seadrift Dr
- 1191 Summerview Ln
- 1302 Lakeside Ln
- 1172 Summerview Ln
- 1181 Summerview Ln
- 761 Seadrift Dr
- 1304 Lakeside Ln
- 1162 Summerview Ln
- 1192 Shorecrest Ln
- 1171 Summerview Ln
- 751 Seadrift Dr
- 1301 Lakeside Ln
- 1182 Shorecrest Ln
- 1308 Lakeside Ln
- 1152 Summerview Ln
- 1161 Summerview Ln