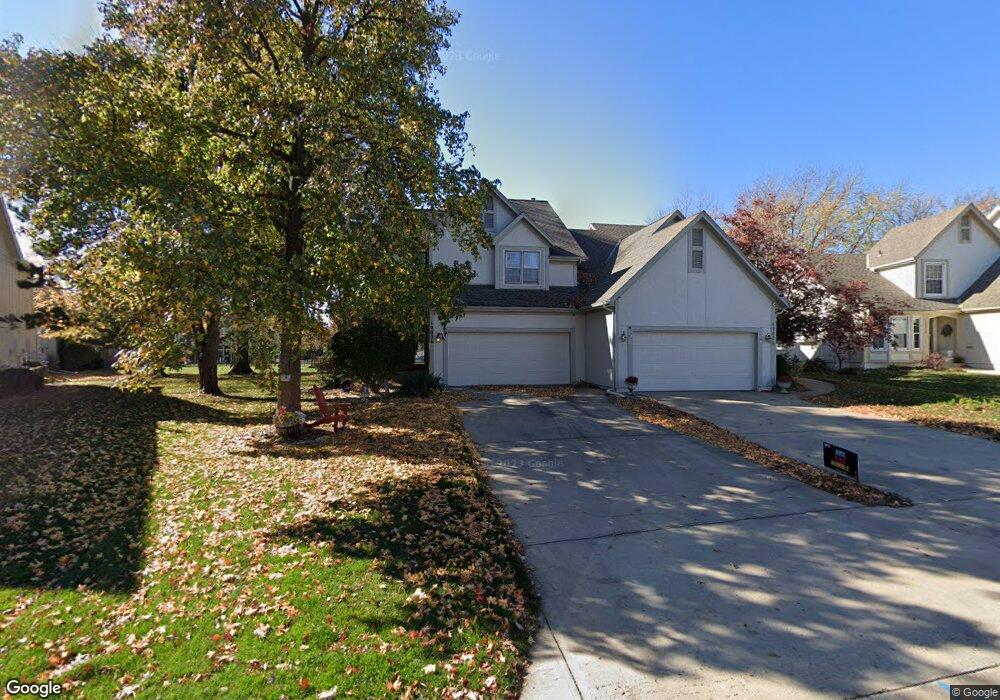
12026 England St Overland Park, KS 66213
Central Overland Park NeighborhoodEstimated Value: $335,000 - $381,000
2
Beds
3
Baths
1,459
Sq Ft
$240/Sq Ft
Est. Value
About This Home
This home is located at 12026 England St, Overland Park, KS 66213 and is currently estimated at $350,585, approximately $240 per square foot. 12026 England St is a home located in Johnson County with nearby schools including Indian Valley Elementary School, Oxford Middle, and Blue Valley Northwest High School.
Ownership History
Date
Name
Owned For
Owner Type
Purchase Details
Closed on
May 18, 2018
Sold by
Doherty David L and Doherty Maria Gabriela Rocha
Bought by
Doherty David L
Current Estimated Value
Home Financials for this Owner
Home Financials are based on the most recent Mortgage that was taken out on this home.
Original Mortgage
$229,697
Outstanding Balance
$134,846
Interest Rate
4.4%
Mortgage Type
VA
Estimated Equity
$215,739
Purchase Details
Closed on
Jul 13, 2006
Sold by
Hynek Kimberly
Bought by
Doherty David L and Rocha Doherty Maria Cabriela
Home Financials for this Owner
Home Financials are based on the most recent Mortgage that was taken out on this home.
Original Mortgage
$26,492
Interest Rate
6.67%
Mortgage Type
Stand Alone Second
Purchase Details
Closed on
May 20, 2002
Sold by
Thomas Phillip B
Bought by
Hynek Kimberly
Home Financials for this Owner
Home Financials are based on the most recent Mortgage that was taken out on this home.
Original Mortgage
$162,400
Interest Rate
6.96%
Mortgage Type
FHA
Create a Home Valuation Report for This Property
The Home Valuation Report is an in-depth analysis detailing your home's value as well as a comparison with similar homes in the area
Home Values in the Area
Average Home Value in this Area
Purchase History
| Date | Buyer | Sale Price | Title Company |
|---|---|---|---|
| Doherty David L | -- | Fidelity National Title | |
| Doherty David L | -- | First American Title | |
| Hynek Kimberly | -- | Security Land Title Company |
Source: Public Records
Mortgage History
| Date | Status | Borrower | Loan Amount |
|---|---|---|---|
| Open | Doherty David L | $229,697 | |
| Previous Owner | Doherty David L | $26,492 | |
| Previous Owner | Doherty David L | $140,800 | |
| Previous Owner | Hynek Kimberly | $162,400 |
Source: Public Records
Tax History Compared to Growth
Tax History
| Year | Tax Paid | Tax Assessment Tax Assessment Total Assessment is a certain percentage of the fair market value that is determined by local assessors to be the total taxable value of land and additions on the property. | Land | Improvement |
|---|---|---|---|---|
| 2024 | $3,719 | $36,765 | $2,624 | $34,141 |
| 2023 | $3,627 | $35,017 | $2,624 | $32,393 |
| 2022 | $3,327 | $31,567 | $2,624 | $28,943 |
| 2021 | $3,327 | $28,830 | $2,624 | $26,206 |
| 2020 | $3,054 | $27,197 | $2,624 | $24,573 |
| 2019 | $3,043 | $26,531 | $2,627 | $23,904 |
| 2018 | $2,903 | $24,806 | $2,627 | $22,179 |
| 2017 | $2,675 | $22,471 | $2,627 | $19,844 |
| 2016 | $2,506 | $21,045 | $2,627 | $18,418 |
| 2015 | $2,386 | $19,987 | $2,627 | $17,360 |
| 2013 | -- | $20,942 | $2,627 | $18,315 |
Source: Public Records
Map
Nearby Homes
- 9024 W 121st Terrace
- 11920 Grandview St
- 9001 W 121st Terrace
- 12044 Mackey St
- 9424 W 122nd St
- 8313 W 120th St
- 9505 W 122nd St
- 11739 Grant St
- 12031 Hemlock St
- 11838 Mackey St
- 12229 Carter St
- 12229 Goodman St
- 8031 W 122nd Terrace
- 12221 Farley St
- 11928 Grant St
- 8280 W 117th St
- 12209 Wedd St
- 9117 W 125th Terrace
- 8957 W 125th Terrace
- 12506 Knox St
- 12024 England St
- 12030 England St
- 12020 England St
- 12100 England St
- 12102 England St
- 12032 England St
- 12018 England St
- 12059 Hayes St
- 12106 England St
- 12021 England St
- 12019 England St
- 12025 England St
- 12061 Hayes St
- 12012 England St
- 12015 England St
- 12027 England St
- 12008 England St
- 12108 England St
- 12013 England St
- 9163 W 121st St