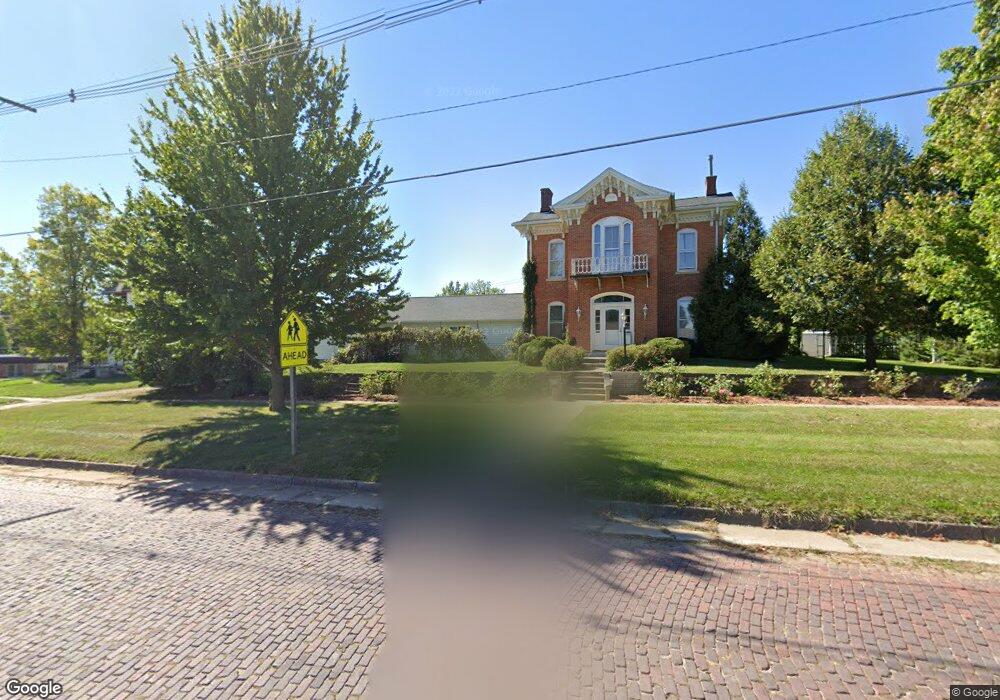
1203 2nd Ave Vinton, IA 52349
Estimated Value: $126,000 - $353,833
4
Beds
2
Baths
3,244
Sq Ft
$84/Sq Ft
Est. Value
About This Home
This home is located at 1203 2nd Ave, Vinton, IA 52349 and is currently estimated at $273,708, approximately $84 per square foot. 1203 2nd Ave is a home located in Benton County with nearby schools including Tilford Elementary School, Shellsburg Elementary School, and Vinton-Shellsburg Middle School.
Ownership History
Date
Name
Owned For
Owner Type
Purchase Details
Closed on
Jul 10, 2009
Sold by
Anthony Dorothy J
Bought by
Aragon Alvin L and Aragon Leigh M
Current Estimated Value
Home Financials for this Owner
Home Financials are based on the most recent Mortgage that was taken out on this home.
Original Mortgage
$200,305
Outstanding Balance
$130,798
Interest Rate
5.32%
Mortgage Type
FHA
Estimated Equity
$142,910
Create a Home Valuation Report for This Property
The Home Valuation Report is an in-depth analysis detailing your home's value as well as a comparison with similar homes in the area
Home Values in the Area
Average Home Value in this Area
Purchase History
| Date | Buyer | Sale Price | Title Company |
|---|---|---|---|
| Aragon Alvin L | $204,000 | None Available |
Source: Public Records
Mortgage History
| Date | Status | Borrower | Loan Amount |
|---|---|---|---|
| Open | Aragon Alvin L | $200,305 |
Source: Public Records
Tax History Compared to Growth
Tax History
| Year | Tax Paid | Tax Assessment Tax Assessment Total Assessment is a certain percentage of the fair market value that is determined by local assessors to be the total taxable value of land and additions on the property. | Land | Improvement |
|---|---|---|---|---|
| 2025 | $5,830 | $355,500 | $29,700 | $325,800 |
| 2024 | $5,830 | $321,400 | $29,700 | $291,700 |
| 2023 | $5,426 | $321,400 | $29,700 | $291,700 |
| 2022 | $5,568 | $261,000 | $23,800 | $237,200 |
| 2021 | $5,568 | $261,000 | $23,800 | $237,200 |
| 2020 | $4,060 | $196,400 | $27,700 | $168,700 |
| 2019 | $4,298 | $196,400 | $27,700 | $168,700 |
| 2018 | $4,172 | $204,600 | $26,900 | $177,700 |
| 2017 | $4,172 | $204,600 | $26,900 | $177,700 |
| 2016 | $3,850 | $178,400 | $25,100 | $153,300 |
| 2015 | $3,850 | $178,400 | $25,100 | $153,300 |
| 2014 | $3,790 | $175,300 | $0 | $0 |
Source: Public Records
Map
Nearby Homes