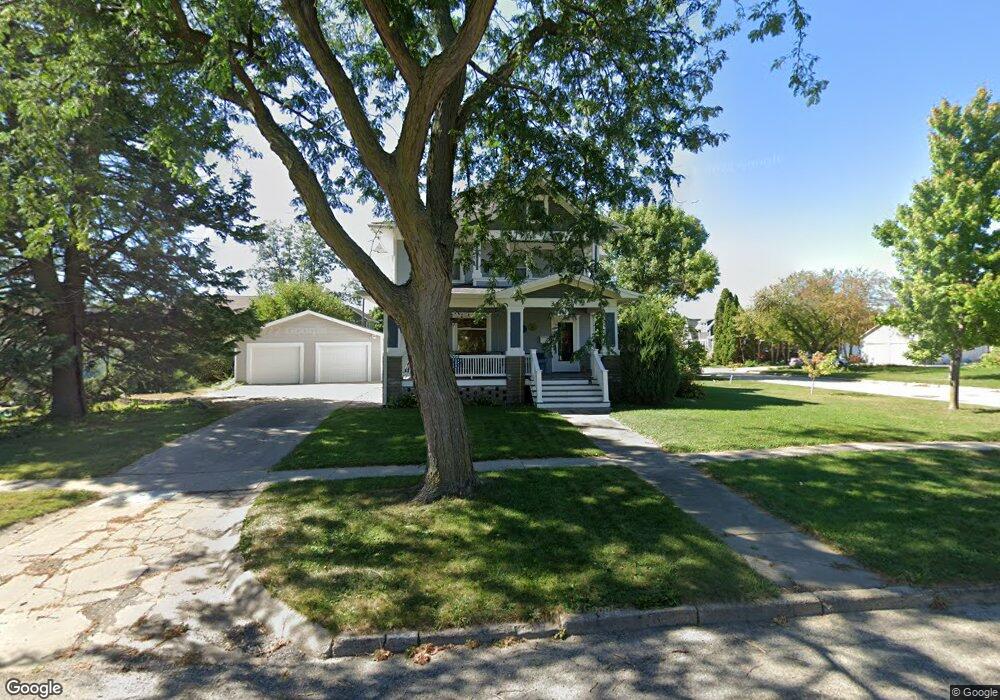
1203 A Ave Vinton, IA 52349
Estimated Value: $210,000 - $291,070
4
Beds
3
Baths
2,254
Sq Ft
$114/Sq Ft
Est. Value
About This Home
This home is located at 1203 A Ave, Vinton, IA 52349 and is currently estimated at $258,018, approximately $114 per square foot. 1203 A Ave is a home located in Benton County with nearby schools including Tilford Elementary School, Shellsburg Elementary School, and Vinton-Shellsburg Middle School.
Ownership History
Date
Name
Owned For
Owner Type
Purchase Details
Closed on
May 8, 2014
Sold by
Rollins Lauri L and Rollins Steven J
Bought by
Rach Brian S and Rach Molly
Current Estimated Value
Home Financials for this Owner
Home Financials are based on the most recent Mortgage that was taken out on this home.
Original Mortgage
$172,000
Interest Rate
4.13%
Mortgage Type
New Conventional
Purchase Details
Closed on
Oct 8, 2007
Sold by
Kotouc Charles F and Kotouc Marlyce A
Bought by
Rollins Steven J and Rollins Lauri J
Home Financials for this Owner
Home Financials are based on the most recent Mortgage that was taken out on this home.
Original Mortgage
$28,500
Interest Rate
6.49%
Mortgage Type
Credit Line Revolving
Create a Home Valuation Report for This Property
The Home Valuation Report is an in-depth analysis detailing your home's value as well as a comparison with similar homes in the area
Home Values in the Area
Average Home Value in this Area
Purchase History
| Date | Buyer | Sale Price | Title Company |
|---|---|---|---|
| Rach Brian S | $215,000 | None Available | |
| Rollins Steven J | $190,000 | None Available |
Source: Public Records
Mortgage History
| Date | Status | Borrower | Loan Amount |
|---|---|---|---|
| Previous Owner | Rach Brian S | $172,000 | |
| Previous Owner | Rollins Steven J | $28,500 | |
| Previous Owner | Rollins Steven J | $152,000 |
Source: Public Records
Tax History Compared to Growth
Tax History
| Year | Tax Paid | Tax Assessment Tax Assessment Total Assessment is a certain percentage of the fair market value that is determined by local assessors to be the total taxable value of land and additions on the property. | Land | Improvement |
|---|---|---|---|---|
| 2025 | $4,728 | $290,700 | $22,300 | $268,400 |
| 2024 | $4,728 | $262,600 | $22,300 | $240,300 |
| 2023 | $4,396 | $262,600 | $22,300 | $240,300 |
| 2022 | $4,512 | $213,200 | $17,800 | $195,400 |
| 2021 | $4,512 | $213,200 | $17,800 | $195,400 |
| 2020 | $4,844 | $232,600 | $18,800 | $213,800 |
| 2019 | $4,732 | $232,600 | $18,800 | $213,800 |
| 2018 | $4,592 | $224,400 | $18,000 | $206,400 |
| 2017 | $4,592 | $224,400 | $18,000 | $206,400 |
| 2016 | $4,338 | $209,700 | $16,800 | $192,900 |
| 2015 | $4,338 | $209,700 | $16,800 | $192,900 |
| 2014 | $4,076 | $188,500 | $0 | $0 |
Source: Public Records
Map
Nearby Homes