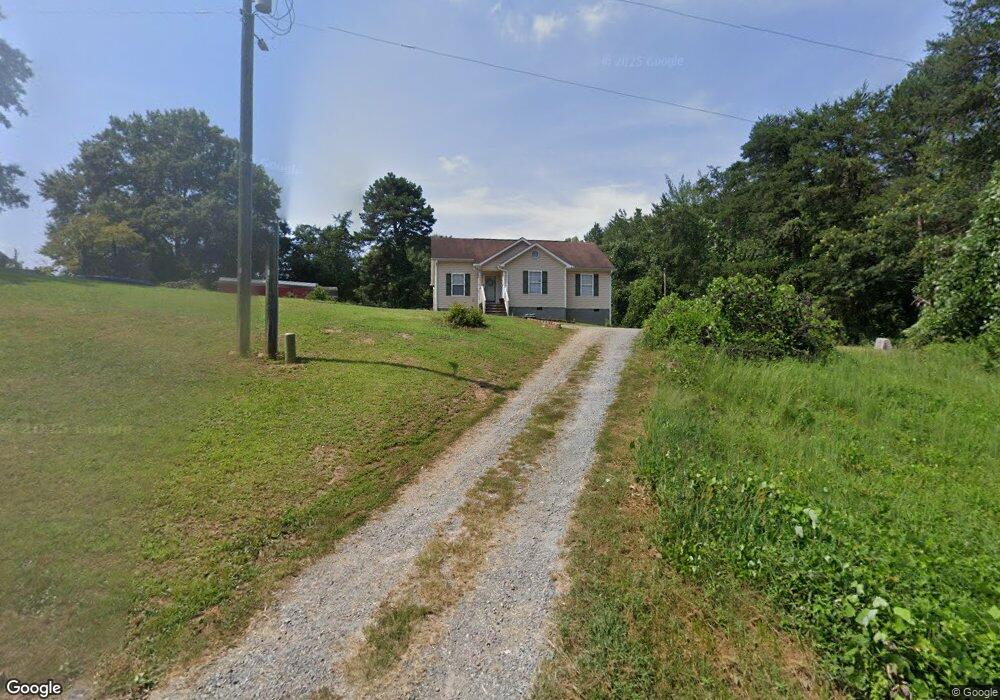
1203 Fulp Rd Walnut Cove, NC 27052
Estimated Value: $194,615 - $243,000
3
Beds
2
Baths
1,157
Sq Ft
$186/Sq Ft
Est. Value
About This Home
This home is located at 1203 Fulp Rd, Walnut Cove, NC 27052 and is currently estimated at $215,404, approximately $186 per square foot. 1203 Fulp Rd is a home located in Stokes County with nearby schools including Walnut Cove Elementary School, Southeastern Stokes Middle School, and South Stokes High.
Ownership History
Date
Name
Owned For
Owner Type
Purchase Details
Closed on
Dec 2, 2019
Sold by
Lash Kendra and Lash Maxine
Bought by
Davis Patrick and Davis Shaniece
Current Estimated Value
Purchase Details
Closed on
Dec 9, 2008
Sold by
Walter Mortgage Company
Bought by
Lash Kendra and Lash Maxine
Home Financials for this Owner
Home Financials are based on the most recent Mortgage that was taken out on this home.
Original Mortgage
$76,984
Interest Rate
5.96%
Mortgage Type
FHA
Purchase Details
Closed on
Nov 19, 2008
Sold by
Gilmore Vicki L and Gilmore Tommy L
Bought by
Walter Mortgage Company
Home Financials for this Owner
Home Financials are based on the most recent Mortgage that was taken out on this home.
Original Mortgage
$76,984
Interest Rate
5.96%
Mortgage Type
FHA
Purchase Details
Closed on
Feb 26, 2007
Sold by
Gilmore Vicki L and Gilmore Tommy L
Bought by
Gilmore Vicki L
Create a Home Valuation Report for This Property
The Home Valuation Report is an in-depth analysis detailing your home's value as well as a comparison with similar homes in the area
Home Values in the Area
Average Home Value in this Area
Purchase History
| Date | Buyer | Sale Price | Title Company |
|---|---|---|---|
| Davis Patrick | $100,000 | Chicago Title Insurance Co | |
| Lash Kendra | $78,000 | None Available | |
| Walter Mortgage Company | $98,712 | None Available | |
| Gilmore Vicki L | -- | None Available |
Source: Public Records
Mortgage History
| Date | Status | Borrower | Loan Amount |
|---|---|---|---|
| Previous Owner | Lash Kendra | $76,984 |
Source: Public Records
Tax History Compared to Growth
Tax History
| Year | Tax Paid | Tax Assessment Tax Assessment Total Assessment is a certain percentage of the fair market value that is determined by local assessors to be the total taxable value of land and additions on the property. | Land | Improvement |
|---|---|---|---|---|
| 2025 | $1,079 | $150,900 | $26,500 | $124,400 |
| 2024 | $1,079 | $104,100 | $20,500 | $83,600 |
| 2023 | $843 | $104,100 | $20,500 | $83,600 |
| 2022 | $770 | $104,100 | $20,500 | $83,600 |
| 2021 | $687 | $104,100 | $20,500 | $83,600 |
| 2020 | $644 | $97,600 | $19,500 | $78,100 |
| 2019 | $722 | $97,600 | $19,500 | $78,100 |
| 2018 | $722 | $97,600 | $19,500 | $78,100 |
| 2017 | $717 | $97,600 | $19,500 | $78,100 |
| 2016 | $696 | $94,700 | $19,500 | $75,200 |
| 2015 | $691 | $94,700 | $19,500 | $75,200 |
| 2014 | $671 | $94,700 | $19,500 | $75,200 |
Source: Public Records
Map
Nearby Homes
- 0 Baileytown Church Rd
- 1125 N Main St
- 2447 Piney Mountain Rd
- 1012 Oldtown Rd
- 000 Wellhouse Dr
- 0 Piney Mountain Rd Unit 1190099
- Lot 3 Bunker Hill Rd
- 3C Jimmie Bullins Rd
- 4D Jimmie Bullins Rd
- 1833 Piney Mountain Rd
- 1031 Red Oak Dr
- 1040 Pink Smith Rd
- 0 S Main St
- Lot 6 Ralph Tuttle Rd
- 664 Spring St
- 657 Spring St
- 814 Montgomery Ct
- 606 Spring St
- 145 Laurel Cliffs Dr Unit C
- 1010 Saint Charles Way