NOT LISTED FOR SALE

1203 S Shore Dr Surf City, NC 28445

Estimated Value: $708,000 - $862,519

4 Beds
2 Baths
2,055 Sq Ft
$384/Sq Ft Est. Value

Last Sold April 30, 2021

Last sale price $422,000 $205 Per Sq Ft

Est. 87% increase in value since last sale

Current estimated payment $4,383/month

About This Home

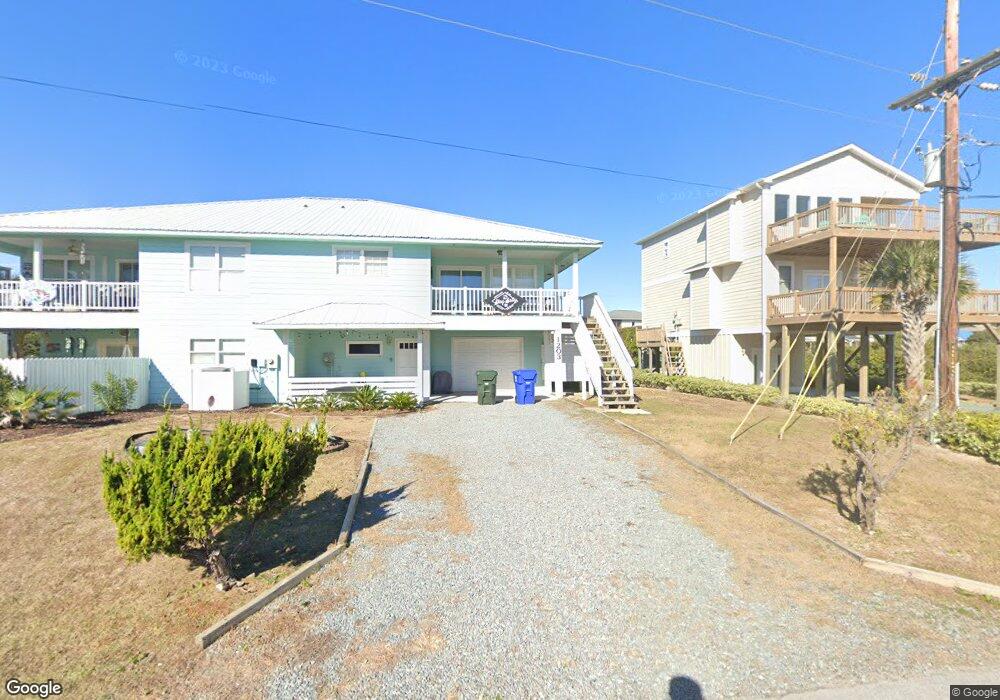
4 bedroom, 2 bath townhome located within the S-curve in Surf City. Just a few blocks from downtown Surf City. Beach access just 4 homes away. Many upgrades. Solid surface countertops and other upgrades the kitchen. New paint throughout. Recently installed heat pump. Ocean views. Covered balcony and screened in porch. Fully furnished. 2019 rental income was $25,848. 2020 rental income - $34,824.

Ownership History

Date Name Owned For Owner Type

Purchase Details

Listed on
Jan 18, 2020
Closed on
Apr 30, 2021
Sold by
Phipps Diana C
Bought by
Pascucci Louis J and Pascucci Sara
Seller's Agent
Bizz Baker
Treasure Realty Inc
Buyer's Agent
Matthew Berglund
Coldwell Banker Sea Coast Advantage-Hampstead
List Price
$449,000
Sold Price
$422,000
Premium/Discount to List
-$27,000
-6.01%
Current Estimated Value
$789,630

Home Financials for this Owner

Home Financials are based on the most recent Mortgage that was taken out on this home.
Estimated Appreciation
$367,630
Avg. Annual Appreciation
14.94%

Purchase Details

Closed on
May 4, 2007
Sold by
Williams Stephen and Williams Nancy
Bought by
Phipps Diana C
Source: Public Records

Range of Values:

Collateral Analytics

Collateral Analytics Collateral Analytics AVMs (Automated Valuation Model) employ a number of statistical approaches combined with neighborhood-specific comparable selection guarantees the most up-to-date and precise valuations.

Not Available

Collateral Analytics does not have data for the current month. Please view the chart for historical values.

ICE

ICE Mortgage Technology ICE Mortgage Technology’s AVM (Automated Valuation Model) is a state-of-the-art online residential property valuation tool that provides a quick and accurate estimate of the value of almost any home in the U.S.

Not Available

ICE Mortgage Technology does not have data for the current month. Please view the chart for historical values.

First American

First American First American Data & Analytics’ next-generation AVM combines unrivaled data assets with a blended ensemble of valuation models to produce highly accurate, reliable valuations you can trust.

Not Available

First American does not have data for the current month. Please view the chart for historical values.

Quantarium

Quantarium Quantarium’s valuation service, repeatedly proven the industry’s most accurate and comprehensive, is supercharged with a self-learning and auto-tuning AI engine that continually becomes smarter and more accurate as it processes daily inputs from the industry’s leading RE data lake.

Not Available

Quantarium does not have data for the current month. Please view the chart for historical values.

Average Value
Not Available
List Price
Sold Price
Create a Home Valuation Report for This Property
The Home Valuation Report is an in-depth analysis detailing your home's value as well as a comparison with similar homes in the area

Home Values in the Area

Source: Public Records

Average Home Value in this Area


Source: Public Records

Purchase History

Date Buyer Sale Price Title Company
Pascucci Louis J $429,000 None Available
Phipps Diana C $170,000 --
Source: Public Records

Property History

Date Event Price List to Sale Price per Sq Ft Prior Sale
04/30/2021 04/30/21 Sold $422,000 -1.6% $205 / Sq Ft View Prior Sale
03/26/2021 03/26/21 Pending -- -- --
01/24/2021 01/24/21 Price Changed $429,000 -4.5% $209 / Sq Ft
01/18/2020 01/18/20 For Sale $449,000 -- $218 / Sq Ft

Tax History Compared to Growth

Source: Public Records

Tax History

Year Tax Paid Tax Assessment Tax Assessment Total Assessment is a certain percentage of the fair market value that is determined by local assessors to be the total taxable value of land and additions on the property. Land Improvement
2024 $2,999 $361,366 $203,942 $157,424
2023 $2,665 $361,366 $203,942 $157,424
2022 $2,665 $361,366 $203,942 $157,424
2021 $2,665 $361,366 $203,942 $157,424
2020 $2,665 $361,366 $203,942 $157,424
2019 $2,665 $361,366 $203,942 $157,424
2018 $2,214 $284,755 $175,000 $109,755
2017 $2,214 $284,755 $175,000 $109,755
2016 $2,185 $284,755 $175,000 $109,755
2015 $2,185 $284,755 $175,000 $109,755
2014 $1,664 $284,755 $175,000 $109,755
2013 -- $284,755 $175,000 $109,755
2012 -- $284,755 $175,000 $109,755
Source: Public Records

Agents Affiliated with this Home

  • Section Image
See All Agents

Map