K
Tenant's Agent in 2021
Katherine Johnson
Jim Maloof Realty, Inc.
1 in this area
27 Total Sales


Estimated Value: $476,000 - $649,000
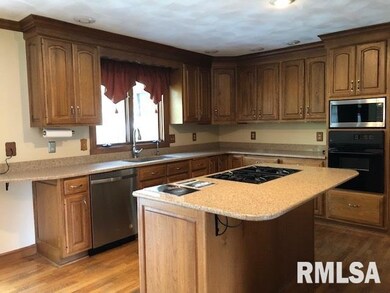
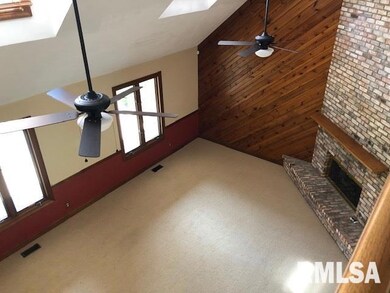
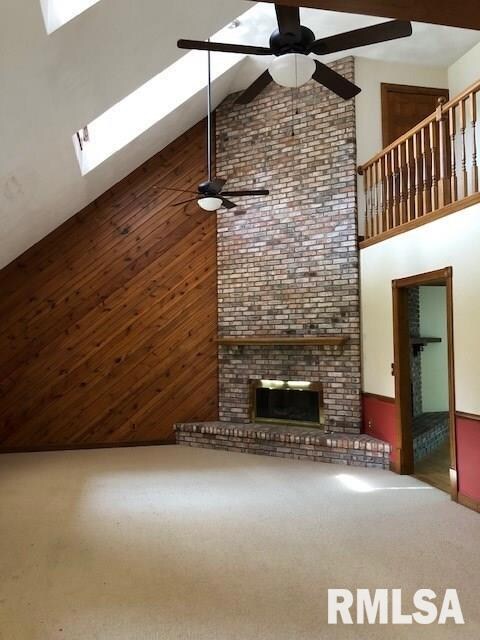
This home is located at 12039 N Hickory Grove Rd, Dunlap, IL 61525 since 27 February 2020 and is currently priced at $564,879. This property was built in 1982. 12039 N Hickory Grove Rd is a home located in Peoria County with nearby schools including Banner Elementary School, Dunlap Middle School, and Dunlap High School.
| Date | Buyer | Sale Price | Title Company |
|---|---|---|---|
| Parkinson Jason M | $297,000 | Heyl Royster Voelker & Allen |
| Date | Status | Borrower | Loan Amount |
|---|---|---|---|
| Open | Parkinson Jason M | $267,300 |
| Date | Event | Price | List to Sale | Price per Sq Ft | Prior Sale |
|---|---|---|---|---|---|
| 06/15/2021 06/15/21 | Rented | $2,200 | +131.6% | -- | |
| 02/26/2021 02/26/21 | Rented | $950 | 0.0% | -- | |
| 08/31/2020 08/31/20 | Sold | $297,000 | 0.0% | $53 / Sq Ft | View Prior Sale |
| 07/20/2020 07/20/20 | Pending | -- | -- | -- | |
| 07/17/2020 07/17/20 | For Sale | $297,000 | 0.0% | $53 / Sq Ft | |
| 07/15/2020 07/15/20 | Under Contract | -- | -- | -- | |
| 02/27/2020 02/27/20 | For Rent | $2,200 | -12.0% | -- | |
| 02/26/2020 02/26/20 | Under Contract | -- | -- | -- | |
| 09/16/2019 09/16/19 | For Rent | $2,500 | -- | -- |
| Year | Tax Paid | Tax Assessment Tax Assessment Total Assessment is a certain percentage of the fair market value that is determined by local assessors to be the total taxable value of land and additions on the property. | Land | Improvement |
|---|---|---|---|---|
| 2024 | $8,928 | $131,690 | $24,100 | $107,590 |
| 2023 | $8,511 | $125,420 | $22,950 | $102,470 |
| 2022 | $8,295 | $120,910 | $21,000 | $99,910 |
| 2021 | $7,991 | $115,150 | $20,000 | $95,150 |
| 2020 | $8,418 | $114,010 | $19,800 | $94,210 |
| 2019 | $8,522 | $117,530 | $20,410 | $97,120 |
| 2018 | $9,901 | $138,380 | $21,350 | $117,030 |
| 2017 | $10,297 | $142,660 | $22,010 | $120,650 |
| 2016 | $9,601 | $142,660 | $22,010 | $120,650 |
| 2015 | $9,279 | $138,510 | $21,370 | $117,140 |
| 2014 | $9,158 | $136,830 | $21,110 | $115,720 |
| 2013 | -- | $135,470 | $20,900 | $114,570 |
K
Tenant's Agent in 2021
Katherine Johnson
Jim Maloof Realty, Inc.
1 in this area
27 Total Sales

Seller's Agent in 2020
Lisa Inman
Move Smart Realty
(309) 472-4627
83 in this area
709 Total Sales
Source: RMLS Alliance
MLS Number: PA1212957
APN: 09-20-427-007
Disclaimer: Certain information contained herein is derived from information provided by parties other than Homes.com. All information provided is deemed reliable, but is not guaranteed to be accurate and should be independently verified.
![]() IDX information is provided exclusively for personal, non-commercial use, and may not be used for any purpose other than to identify prospective properties consumers may be interested in purchasing. Information is deemed reliable but not guaranteed.
IDX information is provided exclusively for personal, non-commercial use, and may not be used for any purpose other than to identify prospective properties consumers may be interested in purchasing. Information is deemed reliable but not guaranteed.