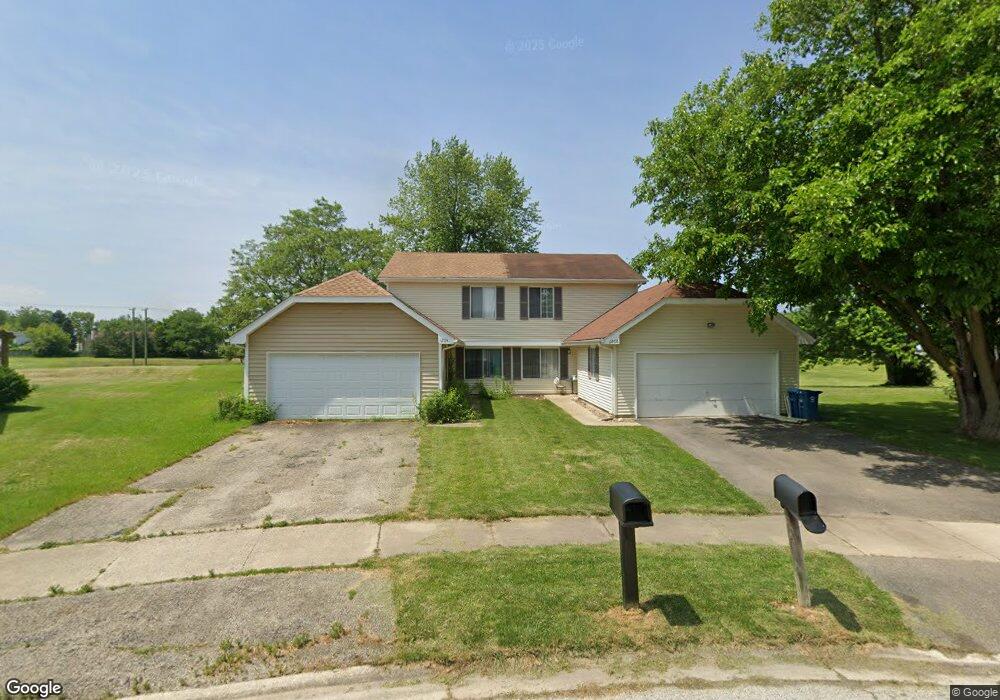
1204 Andover Cir Aurora, IL 60504
South East Village NeighborhoodEstimated Value: $247,000 - $285,774
3
Beds
1
Bath
1,194
Sq Ft
$217/Sq Ft
Est. Value
About This Home
This home is located at 1204 Andover Cir, Aurora, IL 60504 and is currently estimated at $259,694, approximately $217 per square foot. 1204 Andover Cir is a home located in DuPage County with nearby schools including Gombert Elementary School, Fischer Middle School, and Waubonsie Valley High School.
Ownership History
Date
Name
Owned For
Owner Type
Purchase Details
Closed on
Jan 20, 2005
Sold by
Mohammed Saleem
Bought by
Palmer Edwin A
Current Estimated Value
Home Financials for this Owner
Home Financials are based on the most recent Mortgage that was taken out on this home.
Original Mortgage
$144,500
Outstanding Balance
$73,341
Interest Rate
5.83%
Mortgage Type
Purchase Money Mortgage
Estimated Equity
$186,353
Purchase Details
Closed on
Oct 6, 2004
Sold by
Thorson Ernie
Bought by
Mohammed Saleem
Purchase Details
Closed on
May 31, 1995
Sold by
Hodorowski Richard A and Hodorowski Elaine W
Bought by
Thorson Ernie and Thorson Dawn
Home Financials for this Owner
Home Financials are based on the most recent Mortgage that was taken out on this home.
Original Mortgage
$102,812
Interest Rate
8.26%
Mortgage Type
FHA
Create a Home Valuation Report for This Property
The Home Valuation Report is an in-depth analysis detailing your home's value as well as a comparison with similar homes in the area
Home Values in the Area
Average Home Value in this Area
Purchase History
| Date | Buyer | Sale Price | Title Company |
|---|---|---|---|
| Palmer Edwin A | $144,500 | Git | |
| Mohammed Saleem | -- | -- | |
| Thorson Ernie | $103,500 | Ati Title Company |
Source: Public Records
Mortgage History
| Date | Status | Borrower | Loan Amount |
|---|---|---|---|
| Open | Palmer Edwin A | $144,500 | |
| Previous Owner | Thorson Ernie | $102,812 |
Source: Public Records
Tax History
| Year | Tax Paid | Tax Assessment Tax Assessment Total Assessment is a certain percentage of the fair market value that is determined by local assessors to be the total taxable value of land and additions on the property. | Land | Improvement |
|---|---|---|---|---|
| 2024 | $4,691 | $69,690 | $22,614 | $47,076 |
| 2023 | $4,439 | $62,620 | $20,320 | $42,300 |
| 2022 | $4,343 | $57,790 | $18,610 | $39,180 |
| 2021 | $4,219 | $55,730 | $17,950 | $37,780 |
| 2020 | $4,270 | $55,730 | $17,950 | $37,780 |
| 2019 | $4,106 | $53,000 | $17,070 | $35,930 |
| 2018 | $2,766 | $37,320 | $11,940 | $25,380 |
| 2017 | $2,509 | $33,850 | $10,830 | $23,020 |
| 2016 | $2,278 | $30,640 | $9,800 | $20,840 |
| 2015 | $2,234 | $29,090 | $9,300 | $19,790 |
| 2014 | $1,914 | $25,210 | $8,000 | $17,210 |
| 2013 | $1,898 | $25,390 | $8,060 | $17,330 |
Source: Public Records
Map
Nearby Homes
- 1372 Normantown Rd Unit 341
- 3479 Charlemaine Dr
- 3467 Charlemaine Dr
- 2860 Bridgeport Ln Unit 19D
- 1465 Bridgeport Ln Unit 19D
- 1335 Lawrence Ct
- 3431 Charlemaine Dr
- 1661 Charlotte Cir
- 3564 Monarch Cir
- 3700 Monarch Cir
- 2843 Dorothy Dr
- 3138 Cambria Ct Unit 394
- 2730 Dorothy Dr Unit 1
- 1441 Aberdeen Ct
- 3389 Ravinia Cir
- 2950 Shelly Ln Unit 2950
- 2632 Emma Cir
- 2901 Shelly Ln
- 1348 Amaranth Dr
- 10S154 Schoger Dr
- 1206 Andover Cir Unit 18C
- 1202 Andover Cir
- 1208 Andover Cir Unit 18C
- 1210 Andover Cir
- 1198 Andover Cir
- 1212 Andover Cir Unit 18C
- 1207 Andover Cir
- 1196 Andover Cir Unit 18C
- 1205 Andover Cir Unit 18C
- 1214 Andover Cir Unit 18C
- 1217 Andover Cir Unit 18C
- 1194 Andover Cir
- 1215 Andover Cir Unit 18C
- 1216 Andover Cir Unit 18C
- 1192 Andover Cir
- 1275 Andover Cir
- 1277 Andover Cir Unit 18C
- 1218 Andover Cir Unit 18C
- 1265 Andover Cir Unit 18C
- 1227 Andover Cir Unit 18C
Your Personal Tour Guide
Ask me questions while you tour the home.