
Seller's Agent in 2024
Dan Cannon
Cannon Real Estate Development
(410) 610-7728
7 in this area
8 Total Sales
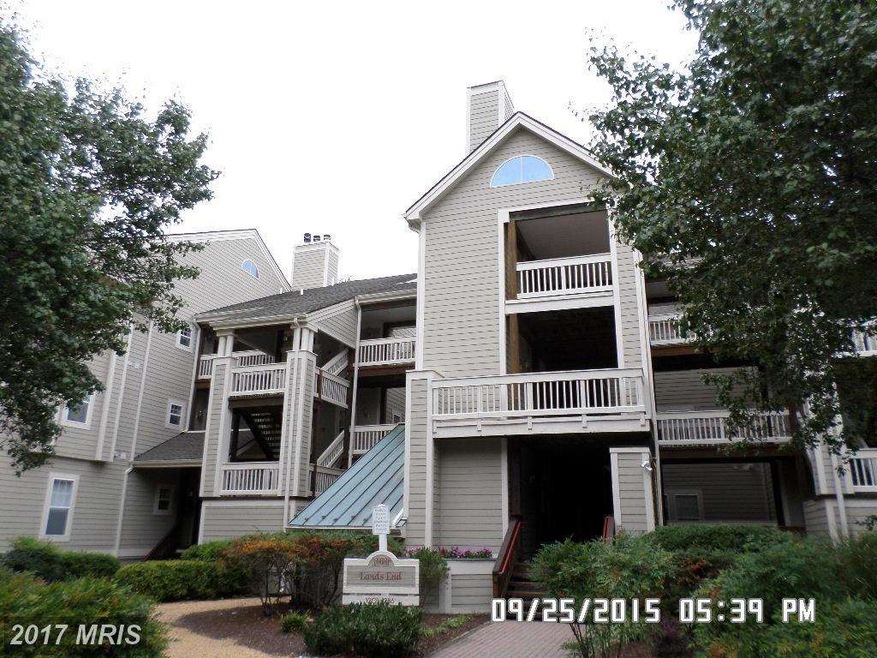
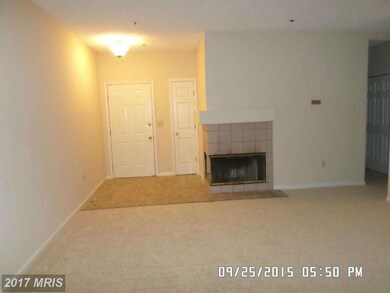
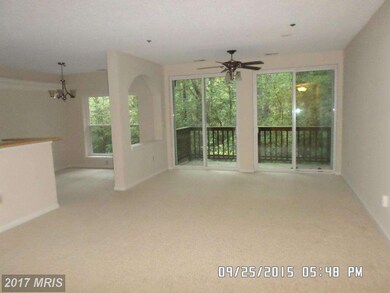
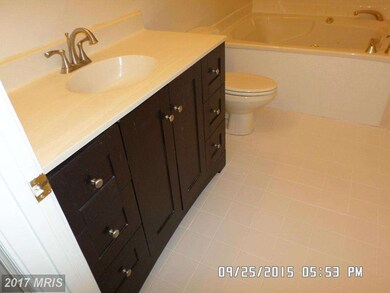
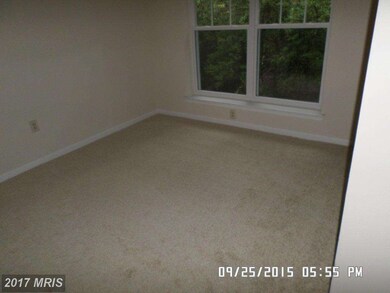
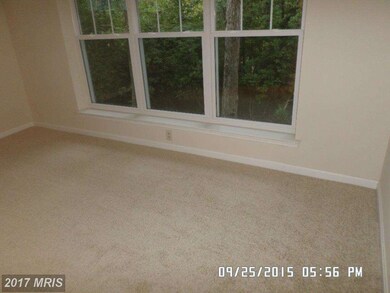
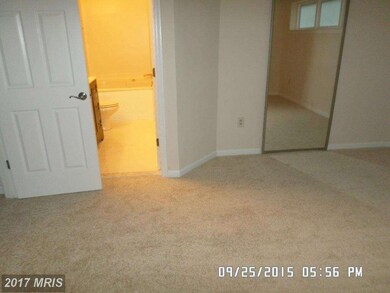
Freshly painted, new carpet. Property is in excellent condition!!
Last Agent to Sell the Property
(240) 568-4100 gladwin@mdreorealty.com Maryland REO Realty, LLC License #308149 Listed on: 09/30/2015
Last Buyer's Agent
(410) 610-7728 cannonred@comcast.net Cannon Real Estate Development License #16905
| Date | Type | Sale Price | Title Company |
|---|---|---|---|
| Deed | -- | None Available | |
| Deed | -- | None Available | |
| Deed | $158,500 | Commonwealth | |
| Deed | -- | -- | |
| Deed | -- | -- | |
| Deed | $259,999 | -- | |
| Deed | $259,999 | None Available | |
| Deed | $100,000 | -- | |
| Foreclosure Deed | $181,000 | -- |
| Date | Status | Loan Amount | Loan Type |
|---|---|---|---|
| Previous Owner | $268,000 | Stand Alone Refi Refinance Of Original Loan | |
| Previous Owner | $268,000 | New Conventional | |
| Previous Owner | $207,920 | New Conventional | |
| Previous Owner | $207,920 | New Conventional |
| Date | Event | Price | Change | Sq Ft Price |
|---|---|---|---|---|
| 02/11/2024 02/11/24 | Rented | $2,150 | 0.0% | -- |
| 02/02/2024 02/02/24 | Under Contract | -- | -- | -- |
| 01/15/2024 01/15/24 | For Rent | $2,150 | +19.4% | -- |
| 04/23/2021 04/23/21 | Rented | $1,800 | 0.0% | -- |
| 04/10/2021 04/10/21 | Under Contract | -- | -- | -- |
| 03/11/2021 03/11/21 | For Rent | $1,800 | +3.2% | -- |
| 09/08/2020 09/08/20 | Rented | $1,745 | 0.0% | -- |
| 08/07/2020 08/07/20 | Price Changed | $1,745 | -2.8% | $1 / Sq Ft |
| 07/16/2020 07/16/20 | For Rent | $1,795 | +2.3% | -- |
| 01/07/2020 01/07/20 | Rented | $1,754 | +6.6% | -- |
| 01/01/2020 01/01/20 | For Rent | $1,645 | 0.0% | -- |
| 06/25/2019 06/25/19 | Rented | $1,645 | 0.0% | -- |
| 06/21/2019 06/21/19 | Under Contract | -- | -- | -- |
| 05/17/2019 05/17/19 | For Rent | $1,645 | 0.0% | -- |
| 06/15/2018 06/15/18 | Rented | $1,645 | 0.0% | -- |
| 06/13/2018 06/13/18 | Under Contract | -- | -- | -- |
| 04/07/2018 04/07/18 | For Rent | $1,645 | -2.9% | -- |
| 01/12/2018 01/12/18 | Rented | $1,695 | 0.0% | -- |
| 01/10/2018 01/10/18 | Under Contract | -- | -- | -- |
| 12/19/2017 12/19/17 | For Rent | $1,695 | -9.6% | -- |
| 10/13/2017 10/13/17 | Rented | $1,875 | +14.0% | -- |
| 10/13/2017 10/13/17 | Under Contract | -- | -- | -- |
| 10/10/2017 10/10/17 | For Rent | $1,645 | -12.3% | -- |
| 11/01/2016 11/01/16 | Rented | $1,875 | +8.7% | -- |
| 10/19/2016 10/19/16 | Under Contract | -- | -- | -- |
| 10/06/2016 10/06/16 | For Rent | $1,725 | -4.2% | -- |
| 05/20/2016 05/20/16 | Rented | $1,800 | +9.1% | -- |
| 05/20/2016 05/20/16 | Under Contract | -- | -- | -- |
| 03/17/2016 03/17/16 | For Rent | $1,650 | 0.0% | -- |
| 01/21/2016 01/21/16 | Sold | $158,500 | -0.9% | -- |
| 12/18/2015 12/18/15 | Pending | -- | -- | -- |
| 12/18/2015 12/18/15 | Price Changed | $159,900 | -4.8% | -- |
| 11/30/2015 11/30/15 | Price Changed | $167,900 | -6.7% | -- |
| 11/06/2015 11/06/15 | Price Changed | $179,900 | -5.3% | -- |
| 09/30/2015 09/30/15 | For Sale | $189,900 | -- | -- |
| Year | Tax Paid | Tax Assessment Tax Assessment Total Assessment is a certain percentage of the fair market value that is determined by local assessors to be the total taxable value of land and additions on the property. | Land | Improvement |
|---|---|---|---|---|
| 2025 | $2,019 | $188,300 | $0 | $0 |
| 2024 | $2,019 | $172,600 | $0 | $0 |
| 2023 | $1,784 | $156,900 | $51,000 | $105,900 |
| 2022 | $1,781 | $156,900 | $51,000 | $105,900 |
| 2021 | $1,783 | $156,900 | $51,000 | $105,900 |
| 2020 | $1,783 | $156,900 | $51,000 | $105,900 |
| 2019 | $1,788 | $176,900 | $51,000 | $125,900 |
| 2018 | $1,985 | $176,900 | $51,000 | $125,900 |
| 2017 | $2,008 | $176,900 | $0 | $0 |
| 2016 | -- | $176,900 | $0 | $0 |
| 2015 | $2,167 | $176,900 | $0 | $0 |
| 2014 | $2,167 | $176,900 | $0 | $0 |
Seller's Agent in 2024
Dan Cannon
Cannon Real Estate Development
(410) 610-7728
7 in this area
8 Total Sales
d
Buyer's Agent in 2024
datacorrect BrightMLS
Non Subscribing Office
Buyer's Agent in 2021
MaryAnne Crewse
O'Brien Realty
(301) 904-9447
68 Total Sales
Buyer's Agent in 2019
Joseph Morgan
Kevin Turner
(240) 298-7545
15 Total Sales
Seller's Agent in 2016
Gladwin D'Costa
Maryland REO Realty, LLC
(240) 568-4100
116 Total Sales
Source: Bright MLS
MLS Number: 1002733236
APN: 01-210203
Disclaimer: Certain information contained herein is derived from information provided by parties other than Homes.com. All information provided is deemed reliable, but is not guaranteed to be accurate and should be independently verified.
![]() The data relating to real estate for sale on this website appears in part through the BRIGHT Internet Data Exchange program, a voluntary cooperative exchange of property listing data between licensed real estate brokerage firms, and is provided by BRIGHT through a licensing agreement.
The data relating to real estate for sale on this website appears in part through the BRIGHT Internet Data Exchange program, a voluntary cooperative exchange of property listing data between licensed real estate brokerage firms, and is provided by BRIGHT through a licensing agreement.
Listing information is from various brokers who participate in the Bright MLS IDX program and not all listings may be visible on the site.
The property information being provided on or through the website is for the personal, non-commercial use of consumers and such information may not be used for any purpose other than to identify prospective properties consumers may be interested in purchasing.
Some properties which appear for sale on the website may no longer be available because they are for instance, under contract, sold or are no longer being offered for sale.
Property information displayed is deemed reliable but is not guaranteed.
Copyright 2025 Bright MLS, Inc.