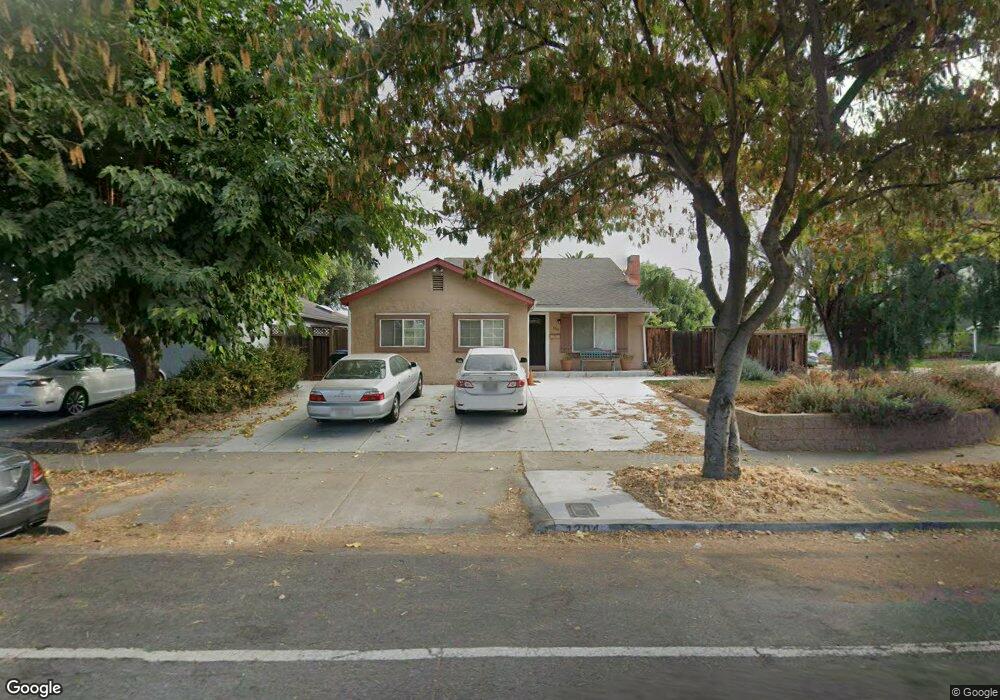
1204 Flickinger Ave San Jose, CA 95131
Flickinger South NeighborhoodEstimated Value: $1,484,533 - $1,617,000
4
Beds
2
Baths
1,168
Sq Ft
$1,321/Sq Ft
Est. Value
About This Home
This home is located at 1204 Flickinger Ave, San Jose, CA 95131 and is currently estimated at $1,543,133, approximately $1,321 per square foot. 1204 Flickinger Ave is a home located in Santa Clara County with nearby schools including Vinci Park Elementary School, Piedmont Middle School, and Independence High School.
Ownership History
Date
Name
Owned For
Owner Type
Purchase Details
Closed on
Nov 27, 2012
Sold by
Nguyen Son Trung and Mai Eileen Thoai Tran
Bought by
Nguyen Son Trung and Mai Eileen Thoai Tran
Current Estimated Value
Home Financials for this Owner
Home Financials are based on the most recent Mortgage that was taken out on this home.
Original Mortgage
$291,000
Outstanding Balance
$201,235
Interest Rate
3.33%
Mortgage Type
New Conventional
Estimated Equity
$1,341,898
Purchase Details
Closed on
Aug 9, 2010
Sold by
Wells Fargo Bank N A
Bought by
Nguyen Son and Mai Eileen
Home Financials for this Owner
Home Financials are based on the most recent Mortgage that was taken out on this home.
Original Mortgage
$301,000
Interest Rate
4.48%
Mortgage Type
New Conventional
Purchase Details
Closed on
Mar 18, 2010
Sold by
Matammu Rexeo C and Matammu Rosemary A
Bought by
Wells Fargo Bank Na
Create a Home Valuation Report for This Property
The Home Valuation Report is an in-depth analysis detailing your home's value as well as a comparison with similar homes in the area
Home Values in the Area
Average Home Value in this Area
Purchase History
| Date | Buyer | Sale Price | Title Company |
|---|---|---|---|
| Nguyen Son Trung | -- | Cornerstone Title Company | |
| Nguyen Son | $430,000 | First American Title Company | |
| Wells Fargo Bank Na | $391,500 | None Available |
Source: Public Records
Mortgage History
| Date | Status | Borrower | Loan Amount |
|---|---|---|---|
| Open | Nguyen Son Trung | $291,000 | |
| Closed | Nguyen Son | $301,000 |
Source: Public Records
Tax History Compared to Growth
Tax History
| Year | Tax Paid | Tax Assessment Tax Assessment Total Assessment is a certain percentage of the fair market value that is determined by local assessors to be the total taxable value of land and additions on the property. | Land | Improvement |
|---|---|---|---|---|
| 2025 | $8,368 | $550,892 | $358,083 | $192,809 |
| 2024 | $8,368 | $540,091 | $351,062 | $189,029 |
| 2023 | $8,205 | $529,502 | $344,179 | $185,323 |
| 2022 | $8,169 | $519,121 | $337,431 | $181,690 |
| 2021 | $7,894 | $508,943 | $330,815 | $178,128 |
| 2020 | $7,641 | $503,725 | $327,423 | $176,302 |
| 2019 | $7,349 | $493,849 | $321,003 | $172,846 |
| 2018 | $7,241 | $484,166 | $314,709 | $169,457 |
| 2017 | $7,674 | $474,674 | $308,539 | $166,135 |
| 2016 | $7,358 | $465,368 | $302,490 | $162,878 |
| 2015 | $7,275 | $458,379 | $297,947 | $160,432 |
| 2014 | $6,254 | $449,401 | $292,111 | $157,290 |
Source: Public Records
Map
Nearby Homes
- 2044 Voss Park Ln
- 1137 Mallow Terrace
- 1087 Yarrow Terrace
- 1088 Mallow Terrace
- 1055 Thyme Walkway
- 2109 Kiwi Walkway
- 1809 Sageland Dr
- 1049 Branbury Way
- 1968 Nutmeg Ct
- 2064 Wizard Ct
- 1997 Lowney Way
- 1210 Briarcreek Ct
- 2328 Mossdale Way
- 2324 Mossdale Way
- 1146 Rosebriar Way
- 2520 Amaryl Dr
- 1055 N Capitol Ave Unit 124
- 1055 N Capitol Ave Unit 180
- 1055 N Capitol Ave Unit 51
- 832 N Jackson Ave
- 1210 Flickinger Ave
- 2067 Imwalle Ct
- 1216 Flickinger Ave
- 2075 Imwalle Ct
- 2052 Imwalle Ct
- 2062 Imwalle Ct
- 2090 Charger Dr
- 2070 Imwalle Ct
- 1222 Flickinger Ave
- 2048 Lunder Ct
- 2085 Imwalle Ct
- 2082 Charger Dr
- 2080 Imwalle Ct
- 2046 Lunder Ct
- 2049 Lunder Ct
- 2096 Charger Dr
- 2044 Lunder Ct
- 2047 Lunder Ct
- 1228 Flickinger Ave
- 2088 Imwalle Ct