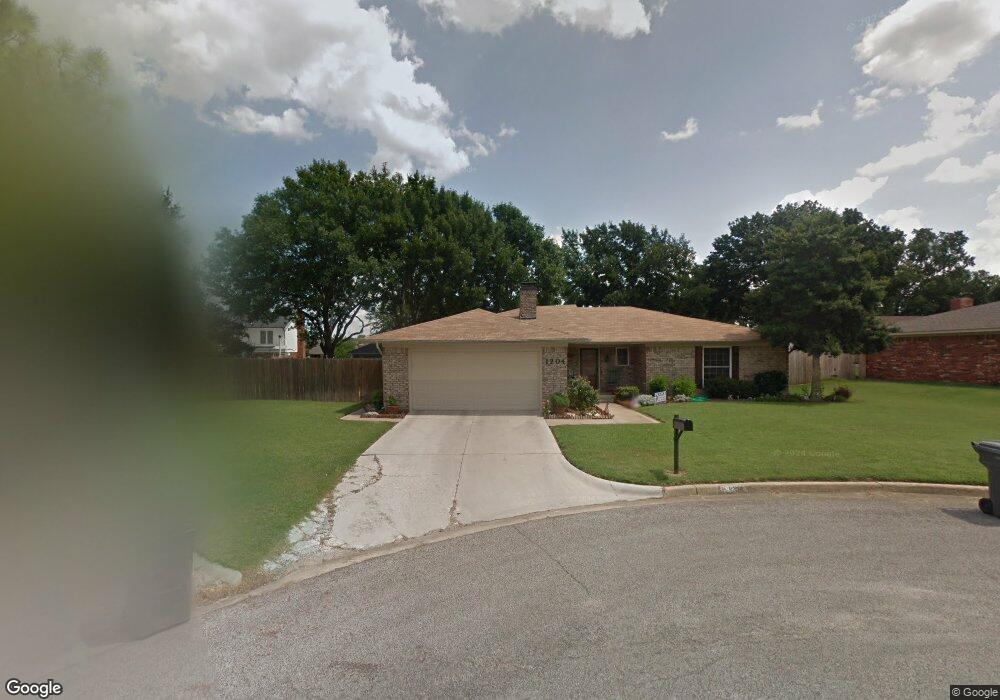
1204 Holly St Ardmore, OK 73401
Estimated Value: $252,235 - $284,000
2
Beds
2
Baths
1,808
Sq Ft
$150/Sq Ft
Est. Value
About This Home
This home is located at 1204 Holly St, Ardmore, OK 73401 and is currently estimated at $271,809, approximately $150 per square foot. 1204 Holly St is a home located in Carter County with nearby schools including Plainview Primary School, Plainview Intermediate School, and Plainview Middle School.
Ownership History
Date
Name
Owned For
Owner Type
Purchase Details
Closed on
Dec 22, 2006
Sold by
George Kristopher W
Bought by
Pearson Gregory D and Pearson Laura L
Current Estimated Value
Home Financials for this Owner
Home Financials are based on the most recent Mortgage that was taken out on this home.
Original Mortgage
$112,000
Outstanding Balance
$65,867
Interest Rate
6.2%
Mortgage Type
New Conventional
Estimated Equity
$205,942
Purchase Details
Closed on
May 14, 2004
Sold by
Campbell Carol J Trustee
Bought by
George Kristopher W
Purchase Details
Closed on
Aug 1, 1998
Sold by
Campbell Carol Jean
Bought by
Campbell, Carol J , Trust
Purchase Details
Closed on
Feb 12, 1998
Sold by
Campbell Wayne C and Campbell Ca
Bought by
Campbell Carol Jean
Purchase Details
Closed on
Mar 18, 1994
Sold by
Atwood Carl G
Bought by
Campbell Wayne C and Campbell Ca
Create a Home Valuation Report for This Property
The Home Valuation Report is an in-depth analysis detailing your home's value as well as a comparison with similar homes in the area
Home Values in the Area
Average Home Value in this Area
Purchase History
| Date | Buyer | Sale Price | Title Company |
|---|---|---|---|
| Pearson Gregory D | $140,000 | -- | |
| George Kristopher W | $115,000 | -- | |
| Campbell, Carol J , Trust | -- | -- | |
| Campbell Carol Jean | -- | -- | |
| Campbell Wayne C | $80,500 | -- |
Source: Public Records
Mortgage History
| Date | Status | Borrower | Loan Amount |
|---|---|---|---|
| Open | Pearson Gregory D | $112,000 |
Source: Public Records
Tax History Compared to Growth
Tax History
| Year | Tax Paid | Tax Assessment Tax Assessment Total Assessment is a certain percentage of the fair market value that is determined by local assessors to be the total taxable value of land and additions on the property. | Land | Improvement |
|---|---|---|---|---|
| 2024 | $1,742 | $19,407 | $3,600 | $15,807 |
| 2023 | $1,689 | $18,842 | $3,600 | $15,242 |
| 2022 | $1,566 | $18,293 | $3,600 | $14,693 |
| 2021 | $1,562 | $17,760 | $3,600 | $14,160 |
| 2020 | $1,529 | $17,243 | $3,600 | $13,643 |
| 2019 | $1,476 | $17,089 | $3,187 | $13,902 |
| 2018 | $1,416 | $16,591 | $2,640 | $13,951 |
| 2017 | $1,450 | $16,893 | $2,640 | $14,253 |
| 2016 | $1,469 | $17,007 | $2,160 | $14,847 |
| 2015 | $1,464 | $16,511 | $1,955 | $14,556 |
| 2014 | $1,423 | $16,030 | $1,800 | $14,230 |
Source: Public Records
Map
Nearby Homes
- 1507 Sunny Ln
- 1413 Sunny Ln
- 1508 Sunny Ln
- 1501 Rosedale St
- 1602 Rosedale St
- 1500 Rosedale St
- 1319 Brookhaven St
- 1223 Buckingham
- 1702 Olive St
- 1831 Sunset Park Terrace
- 1834 Sunset Park Terrace
- 835 Sunset Ct
- 1014 S Commerce St
- 930 P St SW Unit 3
- 924 Manor Mall
- 1121 Surrey Dr
- 917 Q St SW
- 914 Hailey St SW
- 824 Sunset Dr SW
- 1616 6th Ave SW