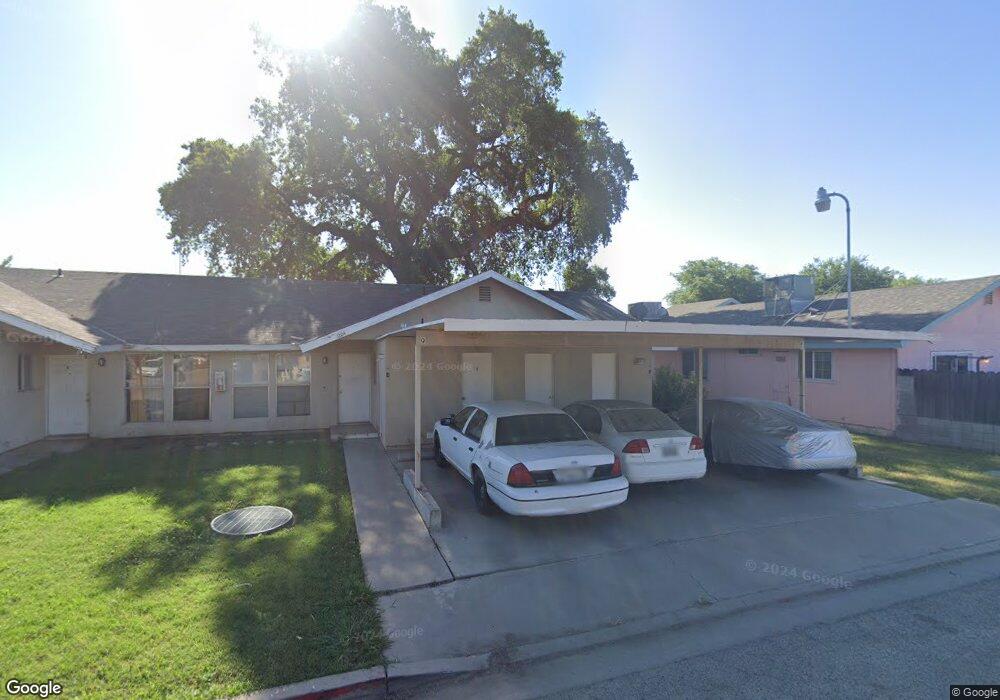
1204 N Divisadero St Visalia, CA 93291
Downtown Visalia NeighborhoodEstimated Value: $258,674 - $381,000
--
Bed
1
Bath
1,688
Sq Ft
$191/Sq Ft
Est. Value
About This Home
This home is located at 1204 N Divisadero St, Visalia, CA 93291 and is currently estimated at $322,919, approximately $191 per square foot. 1204 N Divisadero St is a home located in Tulare County with nearby schools including Houston Elementary School, Green Acres Middle School, and Redwood High School.
Ownership History
Date
Name
Owned For
Owner Type
Purchase Details
Closed on
Mar 21, 2011
Sold by
Banner Investments Llc
Bought by
Beak Investments
Current Estimated Value
Purchase Details
Closed on
Feb 1, 2011
Sold by
The Bank Of New York Mellon
Bought by
Banner Investments Llc
Purchase Details
Closed on
Dec 29, 2010
Sold by
Lopez Alma Vilma
Bought by
The Bank Of New York Mellon and The Bank Of New York
Purchase Details
Closed on
Oct 10, 2005
Sold by
Lopez Julian
Bought by
Lopez Alma Vilma
Home Financials for this Owner
Home Financials are based on the most recent Mortgage that was taken out on this home.
Original Mortgage
$200,000
Interest Rate
1.37%
Mortgage Type
Negative Amortization
Purchase Details
Closed on
May 29, 2004
Sold by
Phillips James Paul
Bought by
Garcia Mauricio David
Home Financials for this Owner
Home Financials are based on the most recent Mortgage that was taken out on this home.
Original Mortgage
$69,300
Interest Rate
4.08%
Mortgage Type
Purchase Money Mortgage
Create a Home Valuation Report for This Property
The Home Valuation Report is an in-depth analysis detailing your home's value as well as a comparison with similar homes in the area
Home Values in the Area
Average Home Value in this Area
Purchase History
| Date | Buyer | Sale Price | Title Company |
|---|---|---|---|
| Beak Investments | -- | None Available | |
| Banner Investments Llc | $55,000 | None Available | |
| The Bank Of New York Mellon | $278,949 | Landsafe Title | |
| Lopez Alma Vilma | -- | Investors Title Company | |
| Lopez Alma Vilma | $250,000 | Investors Title Company | |
| Garcia Mauricio David | $99,000 | Chicago Title Co |
Source: Public Records
Mortgage History
| Date | Status | Borrower | Loan Amount |
|---|---|---|---|
| Previous Owner | Lopez Alma Vilma | $200,000 | |
| Previous Owner | Garcia Mauricio David | $69,300 |
Source: Public Records
Tax History Compared to Growth
Tax History
| Year | Tax Paid | Tax Assessment Tax Assessment Total Assessment is a certain percentage of the fair market value that is determined by local assessors to be the total taxable value of land and additions on the property. | Land | Improvement |
|---|---|---|---|---|
| 2025 | $1,502 | $142,053 | $35,512 | $106,541 |
| 2024 | $1,502 | $139,268 | $34,816 | $104,452 |
| 2023 | $1,461 | $136,538 | $34,134 | $102,404 |
| 2022 | $1,396 | $133,862 | $33,465 | $100,397 |
| 2021 | $1,397 | $131,237 | $32,809 | $98,428 |
| 2020 | $1,383 | $129,892 | $32,473 | $97,419 |
| 2019 | $1,349 | $127,345 | $31,836 | $95,509 |
| 2018 | $1,310 | $124,848 | $31,212 | $93,636 |
| 2017 | $1,301 | $122,400 | $30,600 | $91,800 |
| 2016 | $631 | $59,524 | $21,645 | $37,879 |
| 2015 | $613 | $58,630 | $21,320 | $37,310 |
| 2014 | $613 | $57,481 | $20,902 | $36,579 |
Source: Public Records
Map
Nearby Homes
- 915 N Rinaldi St
- 1500 W Houston Ave
- 825 N Divisadero St
- 1328 N Leslie St
- 1702 W Elowin Ave
- 2014 W Houston Ave
- 916 N Mooney Blvd
- 704 N Divisadero St
- 1200 N Jacob St
- 1933 W Buena Vista Ave
- 1722 N Mooney Blvd
- 1911 W Vine Ave
- 808 N Jacob St
- 1218 W Buena Vista Ave
- 515 N Hall St
- 2015 N Hall Ct
- 2041 N Rinaldi Ct
- 411 N Fairway St
- 1703 N Stevenson St
- 1009 W Goshen Ave
- 1204 N Divisadero St Unit P & Q
- 1204 N Divisadero St Unit JKL
- 1204 N Divisadero St Unit A-C
- 1204 N Divisadero St Unit GHI
- 1204 N Divisadero St Unit R-S
- 1204 N Divisadero St Unit D,E,F
- 1204 N Divisadero St Unit m,n,o
- 1204 N Divisadero St Unit PQ RS
- 1204 N Divisadero St Unit A B C
- 1204 N Divisadero St Unit 3
- 1204 N Divisadero St
- 1204 N Divisadero St
- 1204 N Divisadero St
- 1204 N Divisadero St
- 1204 N Divisadero St
- 1204 N Divisadero St
- 1119 N Rinaldi St
- 1123 N Rinaldi St
- 1115 N Rinaldi St
- 1201 N Rinaldi St