Estimated Value: $605,000 - $624,000
--
Bed
3
Baths
2,383
Sq Ft
$259/Sq Ft
Est. Value
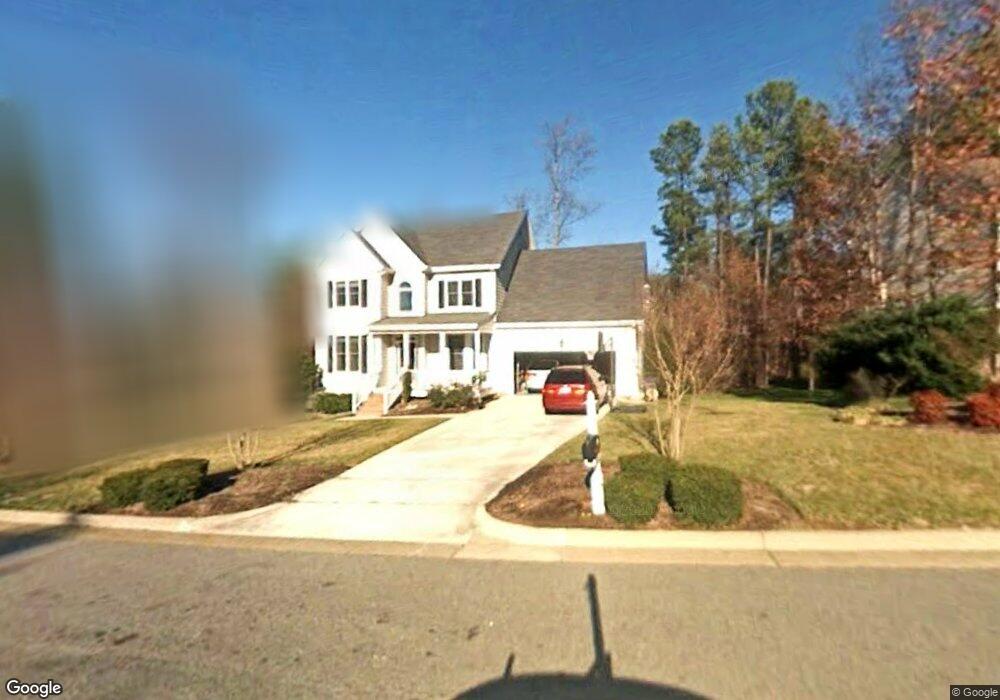
About This Home
This home is located at 1204 Patterson Grove Rd, Apex, NC 27502 and is currently estimated at $617,387, approximately $259 per square foot. 1204 Patterson Grove Rd is a home located in Wake County with nearby schools including Olive Chapel Elementary School, Lufkin Road Middle School, and Apex Friendship High School.
Ownership History
Date
Name
Owned For
Owner Type
Purchase Details
Closed on
Mar 13, 1998
Sold by
F & L Developers Inc
Bought by
Gelm John J and Gelm Jana S
Current Estimated Value
Home Financials for this Owner
Home Financials are based on the most recent Mortgage that was taken out on this home.
Original Mortgage
$153,900
Interest Rate
7.07%
Purchase Details
Closed on
Oct 16, 1997
Sold by
Snyder Hunt Of North Carolina Inc
Bought by
F & L Developers Inc and R W Lee Homes
Home Financials for this Owner
Home Financials are based on the most recent Mortgage that was taken out on this home.
Original Mortgage
$37,817
Interest Rate
7.55%
Create a Home Valuation Report for This Property
The Home Valuation Report is an in-depth analysis detailing your home's value as well as a comparison with similar homes in the area
Home Values in the Area
Average Home Value in this Area
Purchase History
| Date | Buyer | Sale Price | Title Company |
|---|---|---|---|
| Gelm John J | $192,500 | -- | |
| F & L Developers Inc | $37,000 | -- |
Source: Public Records
Mortgage History
| Date | Status | Borrower | Loan Amount |
|---|---|---|---|
| Previous Owner | Gelm John J | $153,900 | |
| Previous Owner | Gelm John J | $135,000 | |
| Previous Owner | F & L Developers Inc | $37,817 |
Source: Public Records
Tax History Compared to Growth
Tax History
| Year | Tax Paid | Tax Assessment Tax Assessment Total Assessment is a certain percentage of the fair market value that is determined by local assessors to be the total taxable value of land and additions on the property. | Land | Improvement |
|---|---|---|---|---|
| 2025 | $4,845 | $552,622 | $180,000 | $372,622 |
| 2024 | $4,737 | $552,622 | $180,000 | $372,622 |
| 2023 | $3,903 | $353,928 | $88,000 | $265,928 |
| 2022 | $3,664 | $353,928 | $88,000 | $265,928 |
| 2021 | $3,524 | $353,928 | $88,000 | $265,928 |
| 2020 | $3,489 | $353,928 | $88,000 | $265,928 |
| 2019 | $3,355 | $293,629 | $88,000 | $205,629 |
| 2018 | $3,160 | $293,629 | $88,000 | $205,629 |
| 2017 | $2,942 | $293,629 | $88,000 | $205,629 |
| 2016 | $2,899 | $293,629 | $88,000 | $205,629 |
| 2015 | $2,829 | $279,681 | $72,000 | $207,681 |
| 2014 | $2,727 | $279,681 | $72,000 | $207,681 |
Source: Public Records
Map
Nearby Homes
- 1311 Pendula Path
- 3014 Silky Dogwood Trail
- 1004 Wild Sonnet Ct
- 1706 Patterson Grove Rd
- 1002 Tribble Gate Ct
- 2008 Silky Dogwood Trail
- 2113 Barrier Ridge Way Unit Lot 26
- 2117 Barrier Ridge Way Unit Lot 24
- 2112 Barrier Ridge Way Unit Lot 34
- 2120 Barrier Ridge Way Unit Lot 36
- 2124 Barrier Ridge Way
- 2118 Barrier Ridge Way Unit Lot 35
- 2122 Barrier Ridge Way Unit Lot 37
- 1127 Palisade Bluff Ln
- 1116 Silky Dogwood Trail
- 1110 Palisade Bluff Ln Unit Lot 5
- 1114 Palisade Bluff Ln Unit Lot 7
- 1112 Palisade Bluff Ln Unit Lot 6
- 1208 Tartarian Trail
- 1117 Palisade Bluff Ln Unit Lot 43
- 1206 Patterson Grove Rd
- 1114 Patterson Grove Rd
- 1304 Brycker Ct
- 1300 Patterson Grove Rd
- 1112 Patterson Grove Rd
- 1205 Patterson Grove Rd
- 1209 Patterson Grove Rd
- 1203 Patterson Grove Rd
- 1207 Patterson Grove Rd
- 1303 Brycker Ct
- 1302 Patterson Grove Rd
- 1908 Patterson Grove Rd
- 1000 Heathwood Dairy Rd
- 1110 Patterson Grove Rd
- 1905 Patterson Grove Rd
- 1003 Heathwood Dairy Rd
- 1313 Chenworth Dr
- 1113 Patterson Grove Rd
- 1002 Heathwood Dairy Rd
- 1309 Chenworth Dr