1204 Pierce Ave Columbus, OH 43227
Beechwood NeighborhoodEstimated Value: $237,000 - $280,000
3
Beds
2
Baths
1,829
Sq Ft
$142/Sq Ft
Est. Value
About This Home
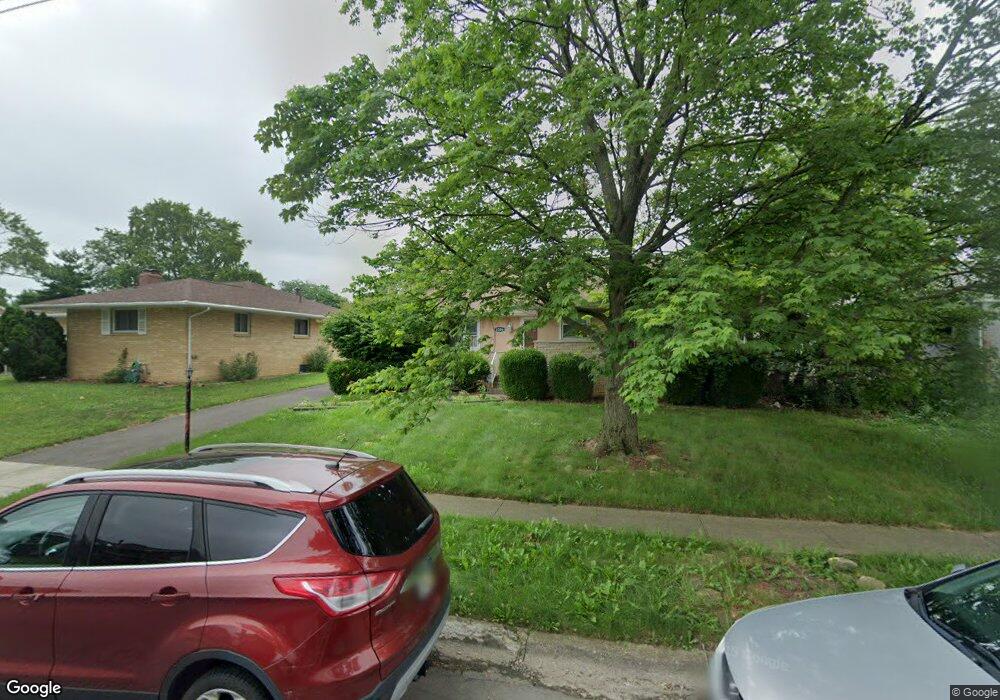
This home is located at 1204 Pierce Ave, Columbus, OH 43227 and is currently estimated at $259,228, approximately $141 per square foot. 1204 Pierce Ave is a home located in Franklin County with nearby schools including Shady Lane Elementary School, Sherwood Middle School, and Walnut Ridge High School.
Ownership History
Date
Name
Owned For
Owner Type
Purchase Details
Closed on
Sep 2, 2008
Sold by
Hud
Bought by
Bowman Laurel
Current Estimated Value
Home Financials for this Owner
Home Financials are based on the most recent Mortgage that was taken out on this home.
Original Mortgage
$90,611
Outstanding Balance
$59,333
Interest Rate
6.54%
Mortgage Type
FHA
Estimated Equity
$199,895
Purchase Details
Closed on
Apr 8, 2008
Sold by
Burress January and Chase Home Finance Llc
Bought by
Hud
Purchase Details
Closed on
Jul 28, 2005
Sold by
Knoll Larry A and Knoll Joyce A
Bought by
Burress January
Purchase Details
Closed on
Jan 28, 2005
Sold by
Moliff Julian S and Moliff Shirley
Bought by
Knoll Larry and Knoll Larry A
Purchase Details
Closed on
Nov 14, 1997
Sold by
Moliff Julian S and Moliff Shirley
Bought by
Moliff Julian S and Moliff Shirley
Create a Home Valuation Report for This Property
The Home Valuation Report is an in-depth analysis detailing your home's value as well as a comparison with similar homes in the area
Home Values in the Area
Average Home Value in this Area
Purchase History
| Date | Buyer | Sale Price | Title Company |
|---|---|---|---|
| Bowman Laurel | $92,000 | Lakeside Ti | |
| Hud | -- | None Available | |
| Burress January | $122,900 | Title First | |
| Knoll Larry | $64,000 | Title First | |
| Moliff Julian S | -- | -- |
Source: Public Records
Mortgage History
| Date | Status | Borrower | Loan Amount |
|---|---|---|---|
| Open | Bowman Laurel | $90,611 |
Source: Public Records
Tax History
| Year | Tax Paid | Tax Assessment Tax Assessment Total Assessment is a certain percentage of the fair market value that is determined by local assessors to be the total taxable value of land and additions on the property. | Land | Improvement |
|---|---|---|---|---|
| 2025 | $3,129 | $69,720 | $14,700 | $55,020 |
| 2024 | $3,129 | $69,720 | $14,700 | $55,020 |
| 2023 | $3,089 | $69,720 | $14,700 | $55,020 |
| 2022 | $2,102 | $40,530 | $6,300 | $34,230 |
| 2021 | $2,106 | $40,530 | $6,300 | $34,230 |
| 2020 | $2,109 | $40,530 | $6,300 | $34,230 |
| 2019 | $1,949 | $32,130 | $5,040 | $27,090 |
| 2018 | $1,850 | $32,130 | $5,040 | $27,090 |
| 2017 | $1,948 | $32,130 | $5,040 | $27,090 |
| 2016 | $1,934 | $29,200 | $5,220 | $23,980 |
| 2015 | $1,756 | $29,200 | $5,220 | $23,980 |
| 2014 | $1,760 | $29,200 | $5,220 | $23,980 |
| 2013 | $1,021 | $34,335 | $6,125 | $28,210 |
Source: Public Records
Map
Nearby Homes
- 4289 Astor Ave
- 1241 Erickson Rd
- 1301 Bernhard Rd
- 4236 E Mound St
- 1253 Dutton Place
- 4382 E Fulton St
- 4366 E Mound St
- 1370 Erickson Rd
- 4111 Colby Ave
- 1281 Maetzel Dr
- 3990 Astor Ave
- 4308 E Main St Unit 1
- 4144 Mcallister Ave
- 1085 S Hamilton Rd
- 1490 Elaine Rd Unit 1462
- 3955 E Fulton St
- 4467 Grimsby Rd
- 4530 Amesbury Rd
- 1243 Simpson Dr
- 1294 Dellwood Ave
- 1196 Pierce Ave
- 4236 Astor Ave
- 1209 Westphal Ave
- 1188 Pierce Ave
- 1201 Westphal Ave
- 4252 Astor Ave
- 1193 Westphal Ave
- 1201 Pierce Ave
- 1180 Pierce Ave
- 1193 Pierce Ave
- 4212 Astor Ave
- 4235 Astor Ave
- 1185 Pierce Ave
- 1185 Westphal Ave
- 4251 Astor Ave
- 1172 Pierce Ave
- 1177 Pierce Ave
- 4211 Astor Ave
- 1238 Pierce Ave
- 1177 Westphal Ave
Your Personal Tour Guide
Ask me questions while you tour the home.