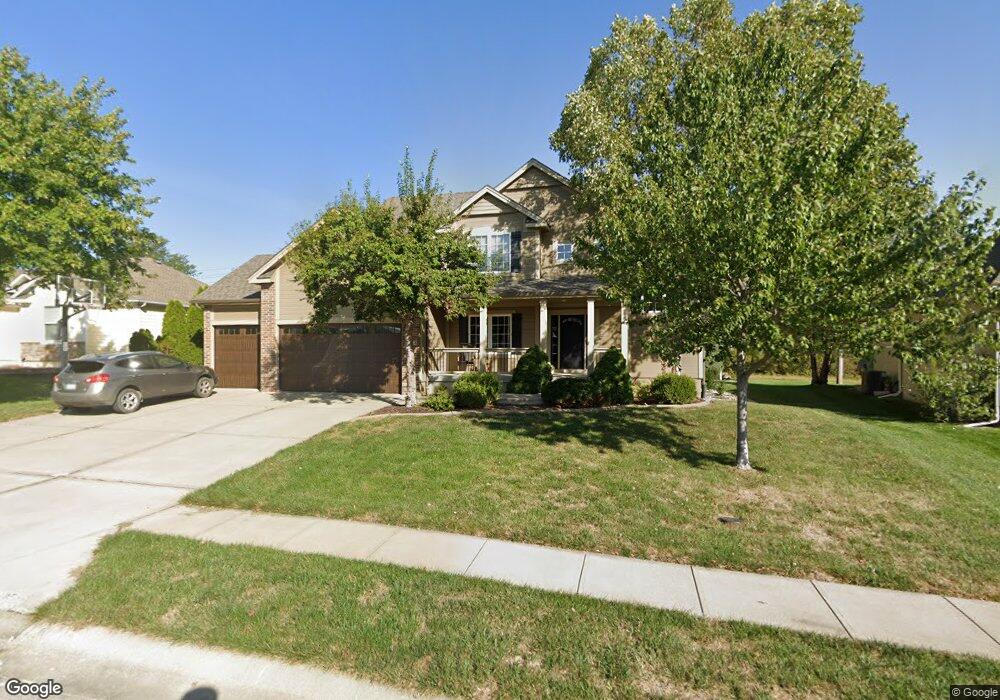
1204 Thompson Cir Raymore, MO 64083
Estimated Value: $536,000 - $577,000
4
Beds
4
Baths
2,855
Sq Ft
$197/Sq Ft
Est. Value
About This Home
This home is located at 1204 Thompson Cir, Raymore, MO 64083 and is currently estimated at $561,727, approximately $196 per square foot. 1204 Thompson Cir is a home located in Cass County with nearby schools including Creekmoor Elementary School, Raymore-Peculiar East Middle School, and Raymore-Peculiar Senior High School.
Ownership History
Date
Name
Owned For
Owner Type
Purchase Details
Closed on
Jun 28, 2010
Sold by
Fletcher Christen L
Bought by
Vogt Joseph W and Vogt Karen E
Current Estimated Value
Home Financials for this Owner
Home Financials are based on the most recent Mortgage that was taken out on this home.
Original Mortgage
$75,000
Outstanding Balance
$47,279
Interest Rate
3.87%
Mortgage Type
New Conventional
Estimated Equity
$514,448
Purchase Details
Closed on
Oct 27, 2005
Sold by
C & M Builders Inc
Bought by
Fletcher Christen L
Purchase Details
Closed on
Mar 17, 2005
Sold by
Cooper Land Development Inc
Bought by
C & M Builders Inc
Home Financials for this Owner
Home Financials are based on the most recent Mortgage that was taken out on this home.
Original Mortgage
$220,000
Interest Rate
5.78%
Mortgage Type
Construction
Create a Home Valuation Report for This Property
The Home Valuation Report is an in-depth analysis detailing your home's value as well as a comparison with similar homes in the area
Home Values in the Area
Average Home Value in this Area
Purchase History
| Date | Buyer | Sale Price | Title Company |
|---|---|---|---|
| Vogt Joseph W | -- | -- | |
| Fletcher Christen L | -- | -- | |
| C & M Builders Inc | -- | -- |
Source: Public Records
Mortgage History
| Date | Status | Borrower | Loan Amount |
|---|---|---|---|
| Open | Vogt Joseph W | $75,000 | |
| Previous Owner | C & M Builders Inc | $220,000 |
Source: Public Records
Tax History
| Year | Tax Paid | Tax Assessment Tax Assessment Total Assessment is a certain percentage of the fair market value that is determined by local assessors to be the total taxable value of land and additions on the property. | Land | Improvement |
|---|---|---|---|---|
| 2025 | $5,655 | $78,750 | $13,790 | $64,960 |
| 2024 | $5,655 | $69,490 | $12,530 | $56,960 |
| 2023 | $5,648 | $69,490 | $12,530 | $56,960 |
| 2022 | $4,968 | $60,730 | $12,530 | $48,200 |
| 2021 | $4,969 | $60,730 | $12,530 | $48,200 |
| 2020 | $4,964 | $59,590 | $12,530 | $47,060 |
| 2019 | $4,792 | $59,590 | $12,530 | $47,060 |
| 2018 | $4,476 | $53,750 | $12,530 | $41,220 |
| 2017 | $4,141 | $53,750 | $12,530 | $41,220 |
| 2016 | $4,141 | $51,620 | $12,530 | $39,090 |
| 2015 | $4,144 | $51,620 | $12,530 | $39,090 |
| 2014 | $4,146 | $51,620 | $12,530 | $39,090 |
| 2013 | -- | $51,620 | $12,530 | $39,090 |
Source: Public Records
Map
Nearby Homes
- 1559 Brompton Ln
- 1427 Young Cir
- 1303 Cross Creek Dr
- 933 Bridgeshire Dr
- 1407 Kensington Ln
- 1225 Kingsland Cir
- 1363 Brompton Ln
- 1317 Granton Ln
- 1362 Brompton Ln
- 1203 Serenity Ct
- 821 Bridgeshire Dr
- 819 Bridgeshire Dr
- 707 Hampstead Dr
- 1201 Richards Cir
- 810 Glenn Cir
- 805 Glenn Cir
- 811 Glenn Cir
- 1620 Hanover Ln
- 518 Turnbridge Dr
- 512 Bentwater Dr
- 1206 Thompson Cir
- 1202 Thompson Cir
- 1208 Thompson Cir
- 1200 Thompson Cir
- 1207 Thompson Cir
- 1205 Thompson Cir
- 1210 Thompson Cir
- 1209 Thompson Cir
- 1201 Thompson Cir
- 1212 Thompson Cir
- 1515 Hodges Ln
- 1203 Thompson Cir
- 1211 Thompson Cir
- 1508 Hodges Ln
- 1214 Thompson Cir
- 1513 Hodges Ln
- 1556 Brompton Ln
- 1506 Hodges Ln
- 1562 Brompton Ln
- 1511 Hodges Ln