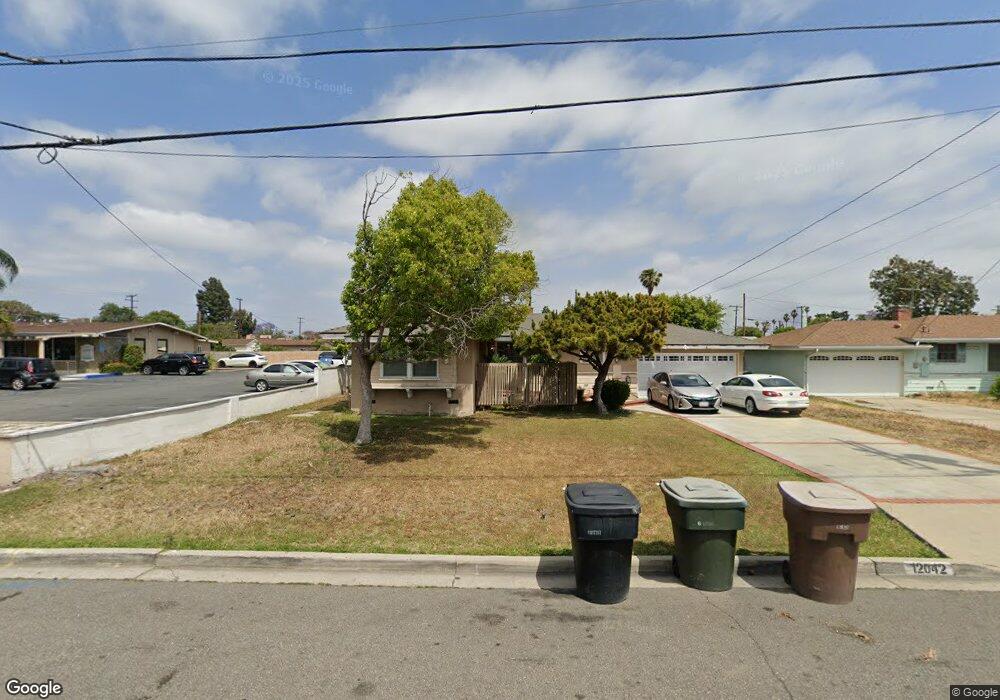
12042 Brookhaven Park Garden Grove, CA 92840
Estimated Value: $952,000 - $1,066,000
3
Beds
2
Baths
1,198
Sq Ft
$839/Sq Ft
Est. Value
About This Home
This home is located at 12042 Brookhaven Park, Garden Grove, CA 92840 and is currently estimated at $1,005,469, approximately $839 per square foot. 12042 Brookhaven Park is a home located in Orange County with nearby schools including Ethel M. Evans Elementary School, Garden Grove High School, and Olive Crest Academy.
Ownership History
Date
Name
Owned For
Owner Type
Purchase Details
Closed on
Oct 3, 2019
Sold by
Miranda David and Padilla Griselda
Bought by
Miranda David and Padilla Griselda
Current Estimated Value
Home Financials for this Owner
Home Financials are based on the most recent Mortgage that was taken out on this home.
Original Mortgage
$326,500
Outstanding Balance
$286,030
Interest Rate
3.5%
Mortgage Type
New Conventional
Estimated Equity
$719,439
Purchase Details
Closed on
Aug 8, 2003
Sold by
Shorr Victoria Johns
Bought by
Miranda David and Padilla Griselda
Home Financials for this Owner
Home Financials are based on the most recent Mortgage that was taken out on this home.
Original Mortgage
$288,750
Interest Rate
6.3%
Mortgage Type
Purchase Money Mortgage
Purchase Details
Closed on
Oct 18, 2002
Sold by
Johns Noreen Victoria
Bought by
Johns Noreen and Shorr Victoria Johns
Create a Home Valuation Report for This Property
The Home Valuation Report is an in-depth analysis detailing your home's value as well as a comparison with similar homes in the area
Home Values in the Area
Average Home Value in this Area
Purchase History
| Date | Buyer | Sale Price | Title Company |
|---|---|---|---|
| Miranda David | -- | Bnt Title Company Of Ca | |
| Miranda David | $385,000 | North American Title Co | |
| Johns Noreen | -- | -- |
Source: Public Records
Mortgage History
| Date | Status | Borrower | Loan Amount |
|---|---|---|---|
| Open | Miranda David | $326,500 | |
| Closed | Miranda David | $288,750 |
Source: Public Records
Tax History Compared to Growth
Tax History
| Year | Tax Paid | Tax Assessment Tax Assessment Total Assessment is a certain percentage of the fair market value that is determined by local assessors to be the total taxable value of land and additions on the property. | Land | Improvement |
|---|---|---|---|---|
| 2025 | $6,731 | $547,385 | $466,695 | $80,690 |
| 2024 | $6,731 | $536,652 | $457,544 | $79,108 |
| 2023 | $6,607 | $526,130 | $448,573 | $77,557 |
| 2022 | $6,467 | $515,814 | $439,777 | $76,037 |
| 2021 | $6,399 | $505,700 | $431,153 | $74,547 |
| 2020 | $6,314 | $500,515 | $426,732 | $73,783 |
| 2019 | $6,192 | $490,701 | $418,364 | $72,337 |
| 2018 | $6,068 | $481,080 | $410,161 | $70,919 |
| 2017 | $5,985 | $471,648 | $402,119 | $69,529 |
| 2016 | $5,686 | $462,400 | $394,234 | $68,166 |
| 2015 | $5,607 | $455,455 | $388,312 | $67,143 |
| 2014 | $5,331 | $434,304 | $372,865 | $61,439 |
Source: Public Records
Map
Nearby Homes
- 11912 Brookhaven St Unit 65
- 12266 Madras Place
- 10087 Hidden Village Rd
- 12262 Morrie Ln
- 10072 Roselee Dr
- 10221 Roselee Dr
- 12342 Rea Cir
- 9901 Royal Palm Blvd
- 11762 Gary St
- 10442 Lampson Ave
- 11971 Medina Dr
- 12071 Diane St
- 10520 Lakeside Dr N Unit L
- 9371 Cellini Ave
- 10560 Lakeside Dr N Unit B
- 10580 Lakeside Dr N Unit E
- 10541 Lakeside Dr S Unit P
- 10521 Lakeside Dr S Unit I
- 11421 Barclay Dr
- 12071 Marlowe Dr
- 12052 Brookhaven Park
- 12041 Sheridan Ln
- 12062 Brookhaven Park
- 12031 Sheridan Ln
- 10132 Chapman Ave
- 12041 Brookhaven Park
- 12061 Sheridan Ln
- 12051 Brookhaven Park
- 12082 Brookhaven Park
- 10082 Chapman Ave
- 10074 Chapman Ave
- 10152 Chapman Ave
- 12061 Brookhaven Park
- 12021 Sheridan Ln
- 12092 Brookhaven Park
- 12081 Brookhaven Park
- 10162 Chapman Ave
- 12081 Sheridan Ln
- 12072 Sheridan Ln
- 12091 Brookhaven Park