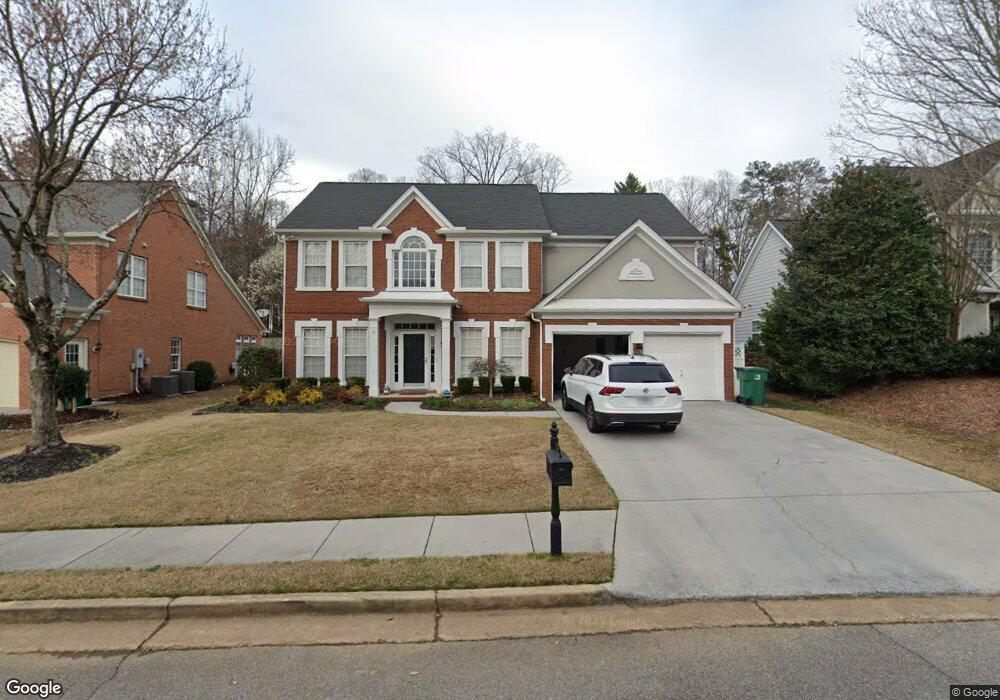
1205 Bickham Way SE Unit 1 Smyrna, GA 30080
Estimated Value: $628,190 - $683,000
4
Beds
3
Baths
2,575
Sq Ft
$253/Sq Ft
Est. Value
About This Home
This home is located at 1205 Bickham Way SE Unit 1, Smyrna, GA 30080 and is currently estimated at $652,548, approximately $253 per square foot. 1205 Bickham Way SE Unit 1 is a home located in Cobb County with nearby schools including Argyle Elementary School, Campbell Middle School, and Campbell High School.
Ownership History
Date
Name
Owned For
Owner Type
Purchase Details
Closed on
May 26, 2016
Sold by
Garland Thomas
Bought by
Solomon Ari and Solomon Amy
Current Estimated Value
Home Financials for this Owner
Home Financials are based on the most recent Mortgage that was taken out on this home.
Original Mortgage
$351,500
Outstanding Balance
$279,818
Interest Rate
3.66%
Mortgage Type
New Conventional
Estimated Equity
$372,730
Purchase Details
Closed on
Jan 13, 1999
Sold by
Pulte Home Corp
Bought by
Garland Thomas and Garland Alison
Home Financials for this Owner
Home Financials are based on the most recent Mortgage that was taken out on this home.
Original Mortgage
$202,455
Interest Rate
6.85%
Mortgage Type
New Conventional
Create a Home Valuation Report for This Property
The Home Valuation Report is an in-depth analysis detailing your home's value as well as a comparison with similar homes in the area
Home Values in the Area
Average Home Value in this Area
Purchase History
| Date | Buyer | Sale Price | Title Company |
|---|---|---|---|
| Solomon Ari | $370,000 | -- | |
| Garland Thomas | $225,000 | -- |
Source: Public Records
Mortgage History
| Date | Status | Borrower | Loan Amount |
|---|---|---|---|
| Open | Solomon Ari | $351,500 | |
| Previous Owner | Garland Thomas | $202,455 |
Source: Public Records
Tax History Compared to Growth
Tax History
| Year | Tax Paid | Tax Assessment Tax Assessment Total Assessment is a certain percentage of the fair market value that is determined by local assessors to be the total taxable value of land and additions on the property. | Land | Improvement |
|---|---|---|---|---|
| 2025 | $5,246 | $229,548 | $60,000 | $169,548 |
| 2024 | $5,246 | $229,548 | $60,000 | $169,548 |
| 2023 | $4,329 | $206,680 | $40,000 | $166,680 |
| 2022 | $4,241 | $174,060 | $40,000 | $134,060 |
| 2021 | $4,113 | $166,168 | $40,000 | $126,168 |
| 2020 | $3,707 | $144,784 | $40,000 | $104,784 |
| 2019 | $3,707 | $144,784 | $40,000 | $104,784 |
| 2018 | $3,980 | $144,784 | $40,000 | $104,784 |
| 2017 | $3,734 | $144,784 | $40,000 | $104,784 |
| 2016 | $2,603 | $118,376 | $40,000 | $78,376 |
| 2015 | $2,657 | $118,376 | $40,000 | $78,376 |
| 2014 | $2,363 | $102,024 | $0 | $0 |
Source: Public Records
Map
Nearby Homes
- 2617 Camphor Crossing SE Unit 88
- 2605 Camphor Crossing SE Unit 91
- Chestatee Plan at Rowan Walk - Cottages Collection
- 2613 Camphor Crossing SE
- 2629 Camphor Crossing SE
- 2613 Camphor Crossing SE Unit 89
- 1572 Wicker Wood Place
- 1572 Wicker Wood SE
- 1576 Wicker Wood Place
- 1142 Drewsbury Ct SE
- 2621 Camphor Crossing Unit 87
- 307 Country Park Dr SE
- 2700 Chestnut Willow Walk Unit 46
- 2308 Country Park Dr SE
- 2736 Chestnut Willow Walk Unit 55
- 2740 Chestnut Willow Walk Unit 56
- 906 Country Park Dr SE
- 907 Country Park Dr SE
- 501 Country Park Dr SE
- 1108 Country Park Dr SE
- 1203 Bickham Way SE
- 1209 Bickham Way SE Unit 1A
- 1201 Bickham Way SE
- 1234 Beecham Dr
- 1236 Beecham Dr
- 1202 Bickham Way SE
- 1416 Wicker Wood Pla
- 1416 Wicker Wood Place
- 1200 Bickham Way SE
- 1204 Bickham Way SE Unit 1A
- 1211 Bickham Way SE
- 1156 Drewsbury Ct SE
- 1206 Bickham Way SE
- 1301 Calderwood Ct SE Unit 1A
- 1303 Calderwood Ct SE
- 1208 Bickham Way SE
- 1154 Drewsbury Ct SE
- 1213 Bickham Way SE
- 1305 Calderwood Ct SE
- 1147 Drewsbury Ct SE