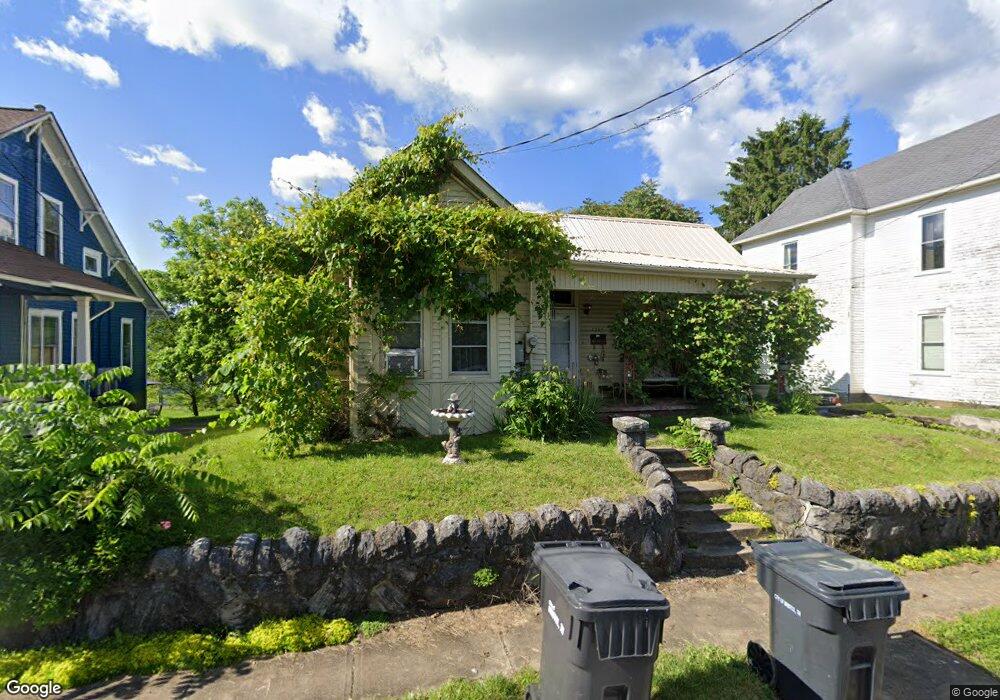
1205 Broad St Bristol, TN 37620
Estimated Value: $101,975 - $164,000
3
Beds
1
Bath
1,133
Sq Ft
$120/Sq Ft
Est. Value
About This Home
This home is located at 1205 Broad St, Bristol, TN 37620 and is currently estimated at $136,244, approximately $120 per square foot. 1205 Broad St is a home located in Sullivan County with nearby schools including Anderson Elementary School, Vance Middle School, and Tennessee High School.
Ownership History
Date
Name
Owned For
Owner Type
Purchase Details
Closed on
Aug 1, 2006
Sold by
Manning Patrick R and Manning Casey M
Bought by
Morgan Pickle
Current Estimated Value
Home Financials for this Owner
Home Financials are based on the most recent Mortgage that was taken out on this home.
Original Mortgage
$56,950
Outstanding Balance
$38,552
Interest Rate
9.25%
Estimated Equity
$97,692
Purchase Details
Closed on
May 9, 2005
Sold by
Volunteer Development Co
Bought by
Manning Patrick R and Manning Casey
Purchase Details
Closed on
Mar 25, 1997
Create a Home Valuation Report for This Property
The Home Valuation Report is an in-depth analysis detailing your home's value as well as a comparison with similar homes in the area
Home Values in the Area
Average Home Value in this Area
Purchase History
| Date | Buyer | Sale Price | Title Company |
|---|---|---|---|
| Morgan Pickle | $67,000 | -- | |
| Manning Patrick R | $49,000 | -- | |
| -- | $35,000 | -- |
Source: Public Records
Mortgage History
| Date | Status | Borrower | Loan Amount |
|---|---|---|---|
| Open | -- | $56,950 | |
| Closed | -- | $6,700 |
Source: Public Records
Tax History Compared to Growth
Tax History
| Year | Tax Paid | Tax Assessment Tax Assessment Total Assessment is a certain percentage of the fair market value that is determined by local assessors to be the total taxable value of land and additions on the property. | Land | Improvement |
|---|---|---|---|---|
| 2024 | -- | $15,875 | $1,750 | $14,125 |
| 2023 | $697 | $15,875 | $1,750 | $14,125 |
| 2022 | $697 | $15,875 | $1,750 | $14,125 |
| 2021 | $697 | $15,875 | $1,750 | $14,125 |
| 2020 | $705 | $15,875 | $1,750 | $14,125 |
| 2019 | $705 | $14,900 | $1,750 | $13,150 |
| 2018 | $702 | $14,900 | $1,750 | $13,150 |
| 2017 | $702 | $14,900 | $1,750 | $13,150 |
| 2016 | $650 | $13,475 | $1,750 | $11,725 |
| 2014 | $614 | $13,485 | $0 | $0 |
Source: Public Records
Map
Nearby Homes