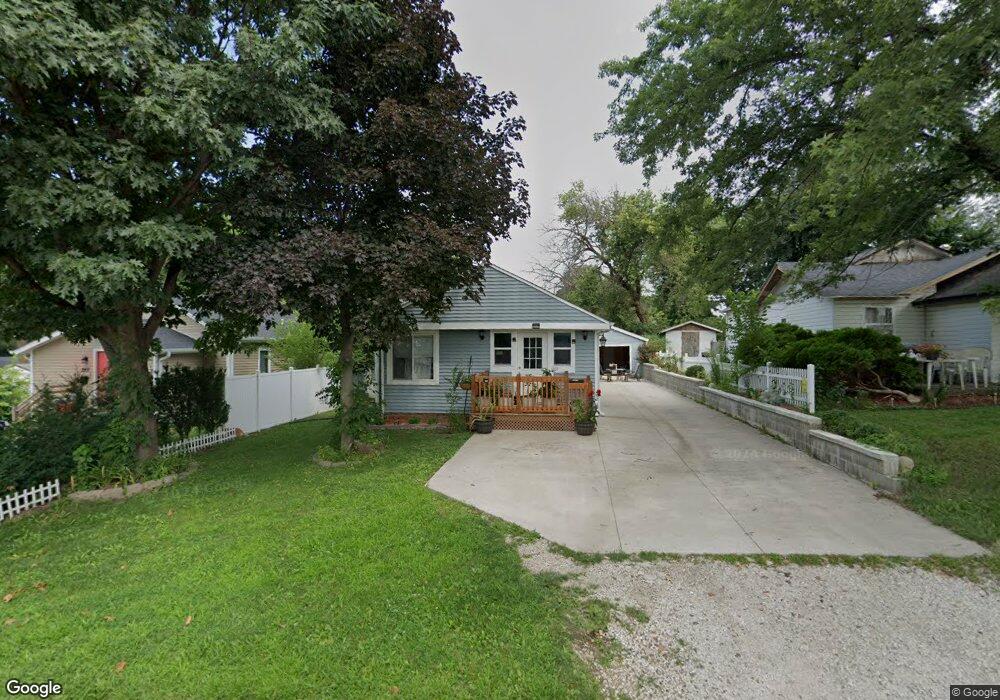
1205 Bundy St Des Moines, IA 50315
Watrous South NeighborhoodEstimated Value: $133,000 - $151,000
2
Beds
1
Bath
976
Sq Ft
$145/Sq Ft
Est. Value
About This Home
This home is located at 1205 Bundy St, Des Moines, IA 50315 and is currently estimated at $141,812, approximately $145 per square foot. 1205 Bundy St is a home located in Polk County with nearby schools including Morris Elementary School, Mccombs Middle School, and Lincoln High School.
Ownership History
Date
Name
Owned For
Owner Type
Purchase Details
Closed on
Feb 24, 2016
Sold by
Serinity Real Estate Investements Llc
Bought by
Kendic Avlima
Current Estimated Value
Purchase Details
Closed on
Jun 26, 2014
Sold by
Brock James L
Bought by
Serenity Real Estate Investments Llc
Home Financials for this Owner
Home Financials are based on the most recent Mortgage that was taken out on this home.
Original Mortgage
$51,000
Interest Rate
4.11%
Mortgage Type
Purchase Money Mortgage
Purchase Details
Closed on
May 21, 2013
Sold by
Brock Shirley J
Bought by
Brock James L
Create a Home Valuation Report for This Property
The Home Valuation Report is an in-depth analysis detailing your home's value as well as a comparison with similar homes in the area
Home Values in the Area
Average Home Value in this Area
Purchase History
| Date | Buyer | Sale Price | Title Company |
|---|---|---|---|
| Kendic Avlima | $74,875 | None Available | |
| Serenity Real Estate Investments Llc | $41,250 | None Available | |
| Brock James L | -- | None Available |
Source: Public Records
Mortgage History
| Date | Status | Borrower | Loan Amount |
|---|---|---|---|
| Previous Owner | Serenity Real Estate Investments Llc | $51,000 |
Source: Public Records
Tax History
| Year | Tax Paid | Tax Assessment Tax Assessment Total Assessment is a certain percentage of the fair market value that is determined by local assessors to be the total taxable value of land and additions on the property. | Land | Improvement |
|---|---|---|---|---|
| 2025 | $2,196 | $127,600 | $28,300 | $99,300 |
| 2024 | $2,196 | $111,600 | $24,700 | $86,900 |
| 2023 | $2,206 | $111,600 | $24,700 | $86,900 |
| 2022 | $2,190 | $93,600 | $20,200 | $73,400 |
| 2021 | $2,046 | $93,600 | $20,200 | $73,400 |
| 2020 | $2,126 | $82,000 | $17,400 | $64,600 |
| 2019 | $1,882 | $82,000 | $17,400 | $64,600 |
| 2018 | $1,862 | $70,000 | $15,500 | $54,500 |
| 2017 | $1,836 | $70,000 | $15,500 | $54,500 |
| 2016 | $1,790 | $67,900 | $14,700 | $53,200 |
| 2015 | $1,790 | $67,900 | $14,700 | $53,200 |
| 2014 | $1,901 | $69,500 | $14,800 | $54,700 |
Source: Public Records
Map
Nearby Homes
- 1208 Burnham Ave
- 1225 West St
- 1315 Johnson St
- 1110 Johnson St
- 1324 Army Post Rd
- 1352 Johnson St
- 6825 SW 15th St
- 1014 Leland Ave
- 1310 Leland Ave
- 6824 SW 15th St
- 6912 SW 15th St
- 6905 SW 16th St
- 919 Randolph St
- 6001 SW 13th Place
- 7307 SW 13th St
- 6504 SW 17th St
- 7400 SW 12th St
- 5915 SW 12th St
- 7300 SW 15th St
- 6006 SW 15th St
Your Personal Tour Guide
Ask me questions while you tour the home.