Estimated Value: $63,000 - $108,922
3
Beds
1
Bath
624
Sq Ft
$140/Sq Ft
Est. Value
About This Home
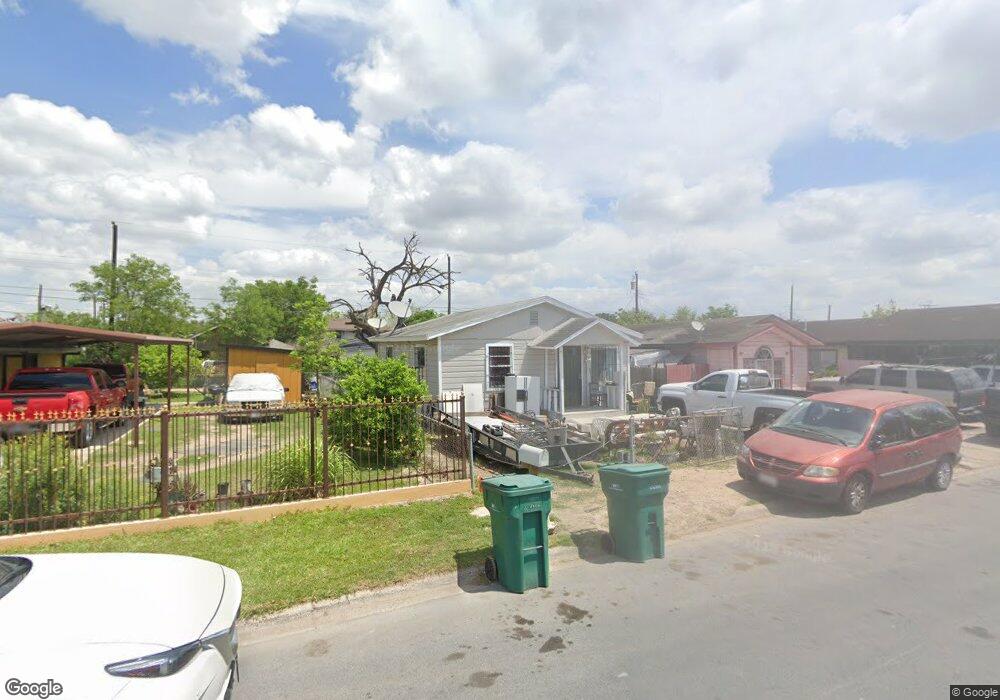
This home is located at 1205 E Juarez Ave, Pharr, TX 78577 and is currently estimated at $87,641, approximately $140 per square foot. 1205 E Juarez Ave is a home located in Hidalgo County with nearby schools including Henry Ford Elementary, Liberty Middle School, and PSJA North Early College High School.
Ownership History
Date
Name
Owned For
Owner Type
Purchase Details
Closed on
Mar 22, 2024
Sold by
Sarcon Family Home Sol Llc
Bought by
Devazquez Maria Isabel Torre
Current Estimated Value
Purchase Details
Closed on
May 27, 2021
Sold by
Contreras Eliana and Vargas Gerardo
Bought by
Sarcon Family Home Solutions Llc
Home Financials for this Owner
Home Financials are based on the most recent Mortgage that was taken out on this home.
Original Mortgage
$27,200
Interest Rate
2.9%
Mortgage Type
Stand Alone First
Purchase Details
Closed on
Jan 11, 2017
Sold by
Contreras Eliana
Bought by
Contreras Eliana and Contreras Ricardo
Purchase Details
Closed on
Oct 22, 2010
Sold by
Contreras Elva
Bought by
Contreras Eliana
Purchase Details
Closed on
Aug 5, 2010
Sold by
Garza Juan Roberto and Garza Antonia N
Bought by
Contreras Elva
Create a Home Valuation Report for This Property
The Home Valuation Report is an in-depth analysis detailing your home's value as well as a comparison with similar homes in the area
Home Values in the Area
Average Home Value in this Area
Purchase History
| Date | Buyer | Sale Price | Title Company |
|---|---|---|---|
| Devazquez Maria Isabel Torre | -- | None Listed On Document | |
| Sarcon Family Home Solutions Llc | -- | Edwards Abstract | |
| Contreras Eliana | -- | None Available | |
| Contreras Eliana | -- | None Available | |
| Contreras Elva | $22,300 | None Available |
Source: Public Records
Mortgage History
| Date | Status | Borrower | Loan Amount |
|---|---|---|---|
| Previous Owner | Sarcon Family Home Solutions Llc | $27,200 |
Source: Public Records
Tax History
| Year | Tax Paid | Tax Assessment Tax Assessment Total Assessment is a certain percentage of the fair market value that is determined by local assessors to be the total taxable value of land and additions on the property. | Land | Improvement |
|---|---|---|---|---|
| 2025 | $1,124 | $68,160 | $22,870 | $45,290 |
| 2024 | $1,124 | $41,911 | $18,296 | $23,615 |
| 2023 | $1,133 | $42,280 | $18,296 | $23,984 |
| 2022 | $1,026 | $36,595 | $13,983 | $22,612 |
| 2021 | $926 | $32,409 | $13,983 | $18,426 |
| 2020 | $589 | $20,370 | $13,983 | $6,387 |
| 2019 | $597 | $20,370 | $9,371 | $10,999 |
| 2018 | $613 | $20,802 | $9,371 | $11,431 |
| 2017 | $631 | $21,233 | $9,371 | $11,862 |
| 2016 | $623 | $20,964 | $9,223 | $11,741 |
| 2015 | $689 | $21,582 | $9,223 | $12,359 |
Source: Public Records
Map
Nearby Homes
- 1220 E Lucas Ave
- 407 N Veterans Blvd
- 1214 E Sanchez St
- 812 E Egly Ave
- 317 S Magnolia St
- 803 Ebony St
- 813 E Villegas Ave
- 918 E Dreyer St
- 1013 E San Antonio Ave
- 502 Miguel Hidalgo St
- 604 W Mesquite St
- 513 E Hawk Ave
- 706 Ebony St
- 903 E San Antonio Ave
- 615 Ebony St
- 613 Ebony St
- 1102 E Eller Ave
- 608 Hackberry Ave
- 000 E Business 83
- 804 E Business 83
- 1207 E Juarez Ave
- 1203 E Juarez Ave
- 1209 E Juarez Ave
- 1211 E Juarez Ave
- 1206 E Lucas Ave
- 1204 E Lucas Ave
- 1202 E Lucas Ave
- 1204 E Juarez Ave
- 1208 E Juarez Ave
- 1210 E Lucas Ave
- 1215 E Juarez Ave
- 1202 E Juarez Ave
- 1210 E Juarez Ave
- 1212 E Lucas Ave
- 1121 E Juarez Ave
- 1212 E Juarez Ave
- 1214 E Lucas Ave
- 1120 E Juarez Ave
- 1120 E Lucas Ave
- 1120 E Lucas Ave
Your Personal Tour Guide
Ask me questions while you tour the home.