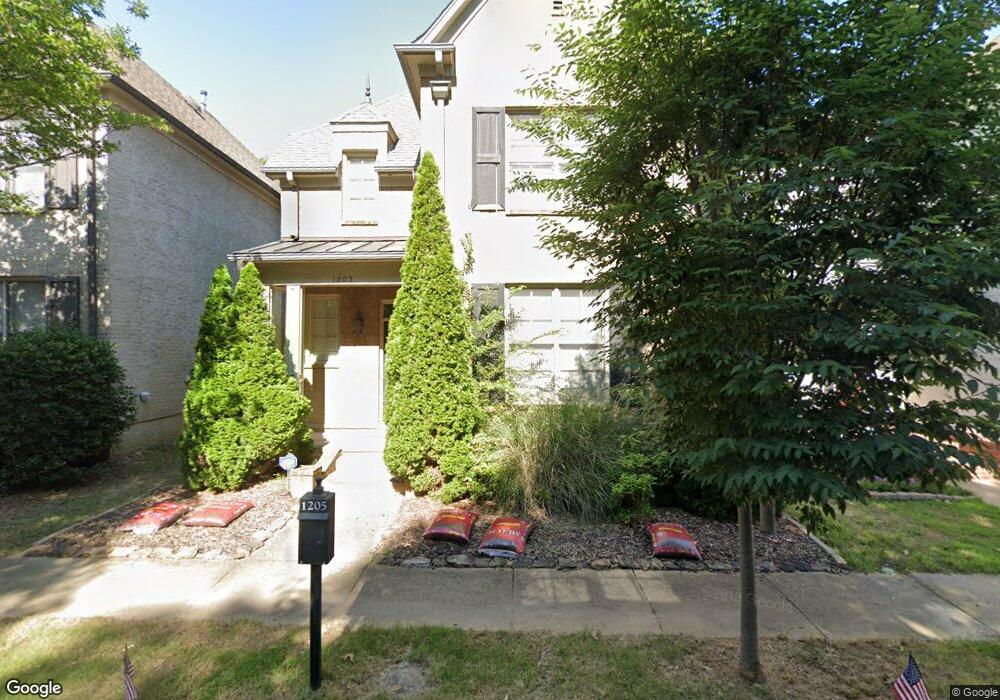
1205 Ecklin Dr Cordova, TN 38016
Cordova NeighborhoodEstimated Value: $303,619 - $390,000
4
Beds
3
Baths
1,969
Sq Ft
$170/Sq Ft
Est. Value
About This Home
This home is located at 1205 Ecklin Dr, Cordova, TN 38016 and is currently estimated at $334,155, approximately $169 per square foot. 1205 Ecklin Dr is a home located in Shelby County with nearby schools including Riverwood Elementary School, Cordova Middle School, and Cordova High School.
Ownership History
Date
Name
Owned For
Owner Type
Purchase Details
Closed on
Dec 30, 2011
Sold by
Fannie Mae
Bought by
Henry Carolyn
Current Estimated Value
Home Financials for this Owner
Home Financials are based on the most recent Mortgage that was taken out on this home.
Original Mortgage
$160,719
Outstanding Balance
$112,372
Interest Rate
4.4%
Mortgage Type
FHA
Estimated Equity
$221,783
Purchase Details
Closed on
Oct 31, 2011
Sold by
Cole Jeremy
Bought by
Federal National Mortgage Association
Home Financials for this Owner
Home Financials are based on the most recent Mortgage that was taken out on this home.
Original Mortgage
$160,719
Outstanding Balance
$112,372
Interest Rate
4.4%
Mortgage Type
FHA
Estimated Equity
$221,783
Purchase Details
Closed on
Jul 28, 2006
Sold by
Navarre Tammy
Bought by
Cole Jeremy
Home Financials for this Owner
Home Financials are based on the most recent Mortgage that was taken out on this home.
Original Mortgage
$175,920
Interest Rate
5.87%
Mortgage Type
New Conventional
Create a Home Valuation Report for This Property
The Home Valuation Report is an in-depth analysis detailing your home's value as well as a comparison with similar homes in the area
Home Values in the Area
Average Home Value in this Area
Purchase History
| Date | Buyer | Sale Price | Title Company |
|---|---|---|---|
| Henry Carolyn | $164,900 | Multiple | |
| Federal National Mortgage Association | $192,732 | None Available | |
| Cole Jeremy | $219,900 | None Available |
Source: Public Records
Mortgage History
| Date | Status | Borrower | Loan Amount |
|---|---|---|---|
| Open | Henry Carolyn | $160,719 | |
| Previous Owner | Cole Jeremy | $175,920 |
Source: Public Records
Tax History
| Year | Tax Paid | Tax Assessment Tax Assessment Total Assessment is a certain percentage of the fair market value that is determined by local assessors to be the total taxable value of land and additions on the property. | Land | Improvement |
|---|---|---|---|---|
| 2025 | $2,035 | $71,300 | $18,375 | $52,925 |
| 2024 | $2,035 | $60,025 | $10,450 | $49,575 |
| 2023 | $3,657 | $60,025 | $10,450 | $49,575 |
| 2022 | $3,657 | $60,025 | $10,450 | $49,575 |
| 2021 | $3,699 | $60,025 | $10,450 | $49,575 |
| 2020 | $3,167 | $43,700 | $10,450 | $33,250 |
| 2019 | $3,166 | $43,700 | $10,450 | $33,250 |
| 2018 | $3,167 | $43,700 | $10,450 | $33,250 |
| 2017 | $1,796 | $43,700 | $10,450 | $33,250 |
| 2016 | $1,921 | $43,950 | $0 | $0 |
| 2014 | $1,921 | $43,950 | $0 | $0 |
Source: Public Records
Map
Nearby Homes
- 1201 Allentown St
- 1206 Chapel Park Blvd
- 8670 Valmont Cir
- 8700 Macon Rd
- 8703 Rogers Park Ave
- 8571 Woodland Rose Cir S
- 1272 Anise Cove
- 8545 Woodland Rose Cir S
- 1229 N Sanga Rd
- 8495 Farley Ave
- 8712 River Hollow Dr
- 8523 Woodland Rose Cir N
- 0 Macon Rd Unit 10186997
- 1025 Belfiore Ln
- 8833 Macon Rd
- 8805 River Rise Dr
- 8544 Griffin Park Dr
- 8727 Thor Rd
- 1362 Cedar Run Cove
- 1222 River Pine Cove
- 1209 Ecklin Dr
- 1201 Ecklin Dr
- 1213 Ecklin Dr
- 1219 Ecklin Dr
- 1219 Ecklin Dr
- 1216 Allentown Cir
- 8625 Rogers Park Ave
- 8631 Rogers Park Ave
- 8615 Rogers Park Ave
- 1206 Allentown St
- 8637 Rogers Park Ave
- 8624 Marysville Ave
- 1198 Allentown St
- 8641 Rogers Park Ave
- 8630 Valmont Cir
- 8622 Marysville Ave
- 8634 Valmont Cir
- 8620 Marysville Ave
- 8638 Valmont Cir
- 8614 Marysville Ave