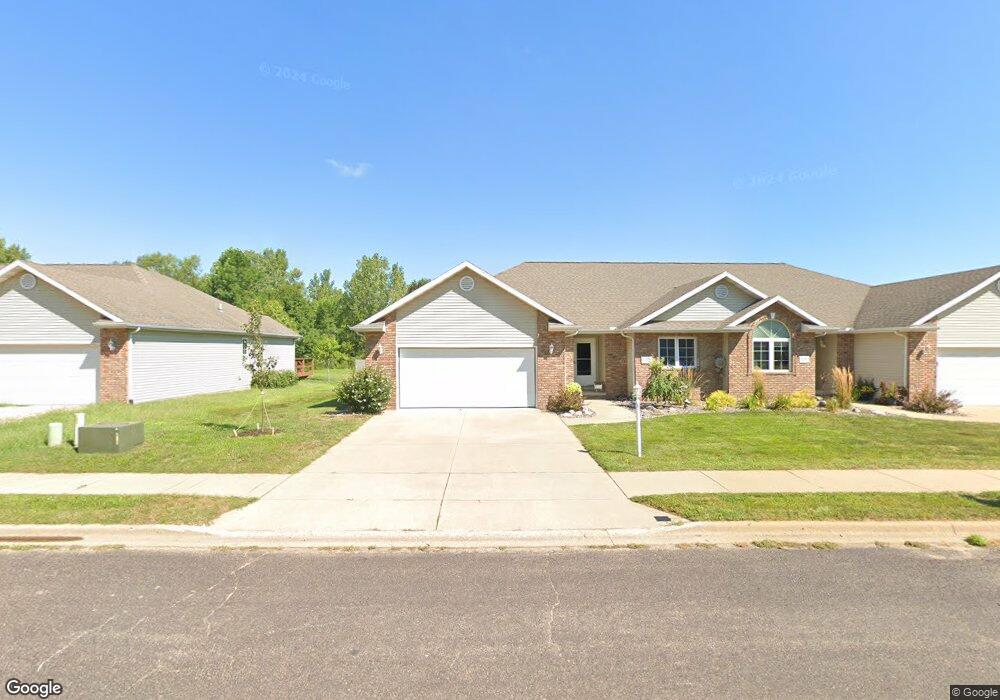
1205 El Camino Dr Pekin, IL 61554
South of Broadway NeighborhoodEstimated Value: $195,950 - $301,000
3
Beds
2
Baths
1,410
Sq Ft
$163/Sq Ft
Est. Value
About This Home
This home is located at 1205 El Camino Dr, Pekin, IL 61554 and is currently estimated at $229,988, approximately $163 per square foot. 1205 El Camino Dr is a home located in Tazewell County with nearby schools including Rankin Elementary School, Pekin Community High School, and Faith Baptist Christian School.
Ownership History
Date
Name
Owned For
Owner Type
Purchase Details
Closed on
Aug 24, 2021
Sold by
Koehne David E and Koehne Yvonne
Bought by
Koehne David E and Koehne Yvonne
Current Estimated Value
Purchase Details
Closed on
Mar 2, 2009
Sold by
Gingoteague Land Corp
Bought by
Koehne David E and Koehne Yvonne
Purchase Details
Closed on
Sep 26, 2007
Sold by
Gingoteague Land Corp
Bought by
Koehne David E and Koehne Yvonne
Home Financials for this Owner
Home Financials are based on the most recent Mortgage that was taken out on this home.
Original Mortgage
$67,000
Interest Rate
6.71%
Mortgage Type
Purchase Money Mortgage
Purchase Details
Closed on
Aug 6, 2007
Sold by
Cross Paul and Cross Maria
Bought by
Koehne David E and Koehne Yvonne
Home Financials for this Owner
Home Financials are based on the most recent Mortgage that was taken out on this home.
Original Mortgage
$67,000
Interest Rate
6.71%
Mortgage Type
Purchase Money Mortgage
Create a Home Valuation Report for This Property
The Home Valuation Report is an in-depth analysis detailing your home's value as well as a comparison with similar homes in the area
Home Values in the Area
Average Home Value in this Area
Purchase History
| Date | Buyer | Sale Price | Title Company |
|---|---|---|---|
| Koehne David E | -- | None Listed On Document | |
| Koehne David E | -- | None Available | |
| Koehne David E | -- | None Available | |
| Koehne David E | $155,000 | First Community Title Svcs |
Source: Public Records
Mortgage History
| Date | Status | Borrower | Loan Amount |
|---|---|---|---|
| Previous Owner | Koehne David E | $67,000 |
Source: Public Records
Tax History Compared to Growth
Tax History
| Year | Tax Paid | Tax Assessment Tax Assessment Total Assessment is a certain percentage of the fair market value that is determined by local assessors to be the total taxable value of land and additions on the property. | Land | Improvement |
|---|---|---|---|---|
| 2024 | $3,775 | $53,480 | $1,550 | $51,930 |
| 2023 | $3,775 | $49,800 | $1,440 | $48,360 |
| 2022 | $3,409 | $45,270 | $1,310 | $43,960 |
| 2021 | $3,739 | $43,530 | $1,260 | $42,270 |
| 2020 | $3,681 | $43,530 | $1,260 | $42,270 |
| 2019 | $3,619 | $43,530 | $1,260 | $42,270 |
| 2018 | $3,599 | $43,530 | $1,260 | $42,270 |
| 2017 | $3,513 | $42,680 | $1,240 | $41,440 |
| 2016 | $3,443 | $42,680 | $1,240 | $41,440 |
| 2015 | $3,277 | $0 | $0 | $0 |
| 2013 | $3,224 | $42,680 | $1,240 | $41,440 |
Source: Public Records
Map
Nearby Homes
- 1416 Vista Grande Dr
- 1802 S 14th St
- 2112 Granada Dr
- 1800 Parkfield Dr
- 1423 S 13th St
- 1824 Valencia Place
- 1406 S 12th St
- 1900 Saint Clair Dr
- 0 Peoria St
- 1424 Henry St
- 1321 S 10th St
- 1504 Henry St
- 1733 Saint Clair Dr
- 1509 Henry St
- 1312 Janssen St
- 1401 S 6th St
- 1301 S 7th St
- 1030 S 13th St
- 1700 Deppert Dr
- 1413 Tennell Rd
- 1203 El Camino Dr
- 1207 El Camino Dr
- 2310 El Camino Dr
- 1201 El Camino Dr
- 1201 Camarillo Dr
- 1200 Camarillo Dr
- 1101 Caspian Dr
- 1203 Camarillo Dr
- 1206 Camarillo Dr
- 1202 Camarillo Dr
- 1103 Caspian Dr
- 1205 Camarillo Dr
- 1220 El Camino Dr
- 1204 Camarillo Dr
- 1100 Caspian Dr
- 1105 Caspian Dr
- 1207 Camarillo Dr
- 1102 Caspian Dr
- 1107 Caspian Dr
- 1112 Caspian Dr