Estimated Value: $96,202 - $147,000
3
Beds
1
Bath
1,336
Sq Ft
$85/Sq Ft
Est. Value
About This Home
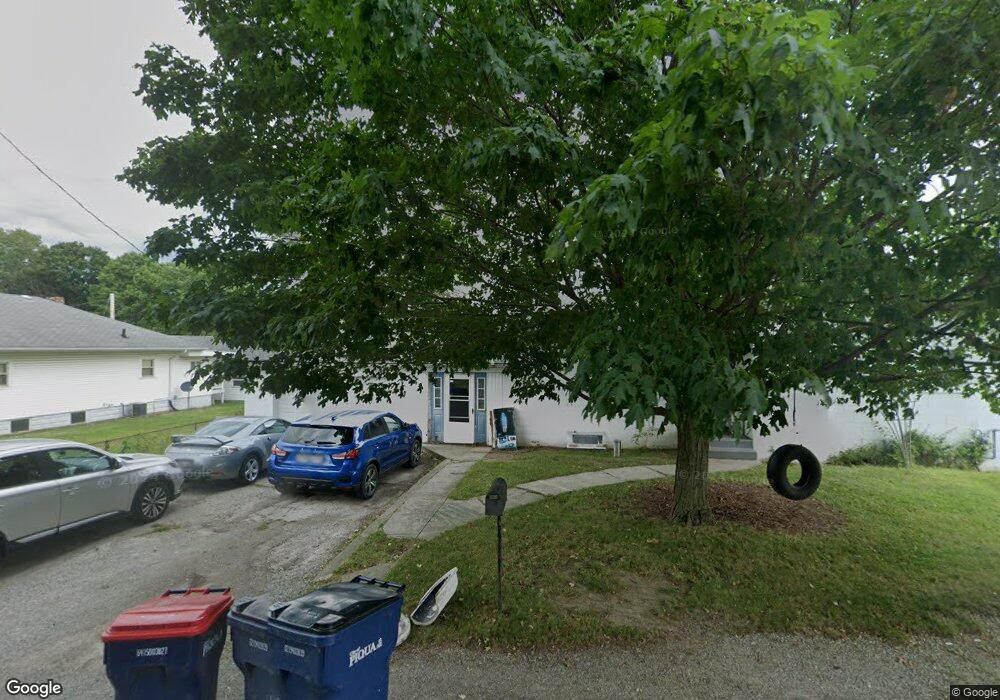
This home is located at 1205 Fisk St, Piqua, OH 45356 and is currently estimated at $113,301, approximately $84 per square foot. 1205 Fisk St is a home located in Miami County with nearby schools including Piqua Junior High School, Piqua High School, and Nicholas School.
Ownership History
Date
Name
Owned For
Owner Type
Purchase Details
Closed on
Sep 18, 2020
Sold by
Sullenberger Rentals Llc
Bought by
Fogt Gerald C and Fogt Glennye
Current Estimated Value
Home Financials for this Owner
Home Financials are based on the most recent Mortgage that was taken out on this home.
Original Mortgage
$55,738
Outstanding Balance
$49,372
Interest Rate
2.8%
Mortgage Type
Future Advance Clause Open End Mortgage
Estimated Equity
$63,929
Purchase Details
Closed on
Jan 25, 2008
Sold by
Sullenberger Philip S and Sullenberger Brenda S
Bought by
Sullenberger Rentals Llc
Purchase Details
Closed on
May 30, 2001
Sold by
Sheriff Of Miami County Ohio
Bought by
Sullenberger Philip S and Sullenberger Brenda S
Purchase Details
Closed on
Mar 1, 1984
Bought by
Chronabery Clifford
Create a Home Valuation Report for This Property
The Home Valuation Report is an in-depth analysis detailing your home's value as well as a comparison with similar homes in the area
Home Values in the Area
Average Home Value in this Area
Purchase History
| Date | Buyer | Sale Price | Title Company |
|---|---|---|---|
| Fogt Gerald C | $62,000 | None Available | |
| Sullenberger Rentals Llc | -- | -- | |
| Sullenberger Philip S | $42,200 | -- | |
| Chronabery Clifford | $27,000 | -- |
Source: Public Records
Mortgage History
| Date | Status | Borrower | Loan Amount |
|---|---|---|---|
| Open | Fogt Gerald C | $55,738 | |
| Closed | Sullenberger Philip S | $0 |
Source: Public Records
Tax History Compared to Growth
Tax History
| Year | Tax Paid | Tax Assessment Tax Assessment Total Assessment is a certain percentage of the fair market value that is determined by local assessors to be the total taxable value of land and additions on the property. | Land | Improvement |
|---|---|---|---|---|
| 2024 | $780 | $18,980 | $7,110 | $11,870 |
| 2023 | $780 | $18,980 | $7,110 | $11,870 |
| 2022 | $794 | $18,980 | $7,110 | $11,870 |
| 2021 | $642 | $14,040 | $5,250 | $8,790 |
| 2020 | $645 | $14,040 | $5,250 | $8,790 |
| 2019 | $649 | $14,040 | $5,250 | $8,790 |
| 2018 | $812 | $16,740 | $5,290 | $11,450 |
| 2017 | $822 | $16,740 | $5,290 | $11,450 |
| 2016 | $813 | $16,740 | $5,290 | $11,450 |
| 2015 | $799 | $16,070 | $5,080 | $10,990 |
| 2014 | $799 | $16,070 | $5,080 | $10,990 |
| 2013 | $802 | $16,070 | $5,080 | $10,990 |
Source: Public Records
Map
Nearby Homes