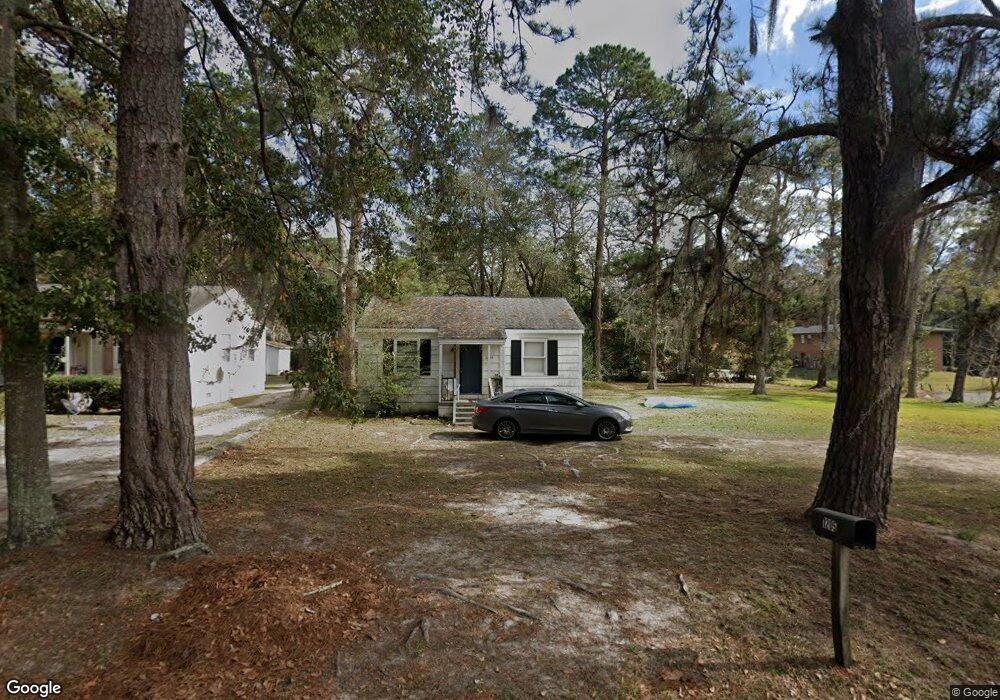
1205 Jo Ree St Valdosta, GA 31601
Estimated Value: $49,000 - $69,000
2
Beds
1
Bath
725
Sq Ft
$79/Sq Ft
Est. Value
About This Home
This home is located at 1205 Jo Ree St, Valdosta, GA 31601 and is currently estimated at $57,258, approximately $78 per square foot. 1205 Jo Ree St is a home located in Lowndes County with nearby schools including S.L. Mason Elementary School, Valdosta Middle School, and Valdosta High School.
Ownership History
Date
Name
Owned For
Owner Type
Purchase Details
Closed on
Aug 2, 2022
Sold by
Spray Properties Llc
Bought by
Sfh1 Llc
Current Estimated Value
Purchase Details
Closed on
Mar 16, 2021
Sold by
Merriman Properties Llc
Bought by
Spray Properties Llc
Home Financials for this Owner
Home Financials are based on the most recent Mortgage that was taken out on this home.
Original Mortgage
$31,227
Interest Rate
2.8%
Mortgage Type
New Conventional
Purchase Details
Closed on
Mar 1, 2017
Sold by
Suemar Properties Llc
Bought by
Merriman Properties Llc
Purchase Details
Closed on
Oct 24, 2011
Sold by
Duke Murray W
Bought by
Suemar Properties Llc
Purchase Details
Closed on
Dec 22, 1998
Bought by
Duke Murray W
Purchase Details
Closed on
Jan 23, 1986
Bought by
Beam Kent Lee
Purchase Details
Closed on
May 31, 1978
Bought by
Buescher Mark F
Purchase Details
Closed on
Apr 25, 1973
Bought by
Bell Oscar M
Purchase Details
Closed on
Nov 3, 1972
Bought by
Caughell William
Create a Home Valuation Report for This Property
The Home Valuation Report is an in-depth analysis detailing your home's value as well as a comparison with similar homes in the area
Home Values in the Area
Average Home Value in this Area
Purchase History
| Date | Buyer | Sale Price | Title Company |
|---|---|---|---|
| Sfh1 Llc | -- | -- | |
| Spray Properties Llc | $30,000 | -- | |
| Merriman Properties Llc | $62,000 | -- | |
| Suemar Properties Llc | -- | -- | |
| Duke Murray W | $21,000 | -- | |
| Beam Kent Lee | $18,700 | -- | |
| Buescher Mark F | $9,800 | -- | |
| Bell Oscar M | $8,100 | -- | |
| Caughell William | $8,900 | -- |
Source: Public Records
Mortgage History
| Date | Status | Borrower | Loan Amount |
|---|---|---|---|
| Previous Owner | Spray Properties Llc | $31,227 |
Source: Public Records
Tax History Compared to Growth
Tax History
| Year | Tax Paid | Tax Assessment Tax Assessment Total Assessment is a certain percentage of the fair market value that is determined by local assessors to be the total taxable value of land and additions on the property. | Land | Improvement |
|---|---|---|---|---|
| 2024 | $393 | $14,059 | $1,747 | $12,312 |
| 2023 | $393 | $14,059 | $1,747 | $12,312 |
| 2022 | $361 | $10,679 | $1,747 | $8,932 |
| 2021 | $371 | $10,679 | $1,747 | $8,932 |
| 2020 | $316 | $8,893 | $1,747 | $7,146 |
| 2019 | $316 | $8,893 | $1,747 | $7,146 |
| 2018 | $320 | $8,893 | $1,747 | $7,146 |
| 2017 | $483 | $13,339 | $5,824 | $7,515 |
| 2016 | $482 | $13,340 | $5,824 | $7,515 |
| 2015 | $443 | $13,340 | $5,824 | $7,515 |
| 2014 | $450 | $13,340 | $5,824 | $7,515 |
Source: Public Records
Map
Nearby Homes
- 1197 Jo Ree St
- 1522 Woodard St
- 1811 Canterbury Dr
- 1911 Baytree Place
- 817 W Cranford Ave
- 503 Roberts St
- 1400 Lankford Dr
- 814 W Alden Ave
- 1205 Mcree Dr
- 1202 Melissa Dr
- 820 W Gordon St
- 2105 Jerry Jones Dr
- 2106 Jerry Jones Dr
- 1501 Harmon Dr
- 1909 Azalea Dr
- 2217 Brighton Place
- 2102 Park Ln
- 2206 White Oak Dr
- 300 Georgia Ave
- 605 N Saint Augustine Rd
- 1207 Jo Ree St
- 1209 Jo Ree St
- 1202 Mcarthur Dr
- 1204 Mcarthur Dr
- 1198 Mcarthur Dr Unit 4
- 1211 Jo Ree St
- 1199 Jo Ree St Unit 4
- 1204 Jo Ree St
- 1206 Jo Ree St
- 1202 Jo Ree St
- 1208 Joree St
- 1208 Jo Ree St
- 1208 Mcarthur Dr
- 1200 Jo Ree St
- 1213 Jo Ree St
- 1210 Jo Ree St
- 1197 Jo Ree St Unit 8
- 1197 Jo Ree St Unit F1-F8
- 1210 Mcarthur Dr
- 1196 Mcarthur Dr Unit H