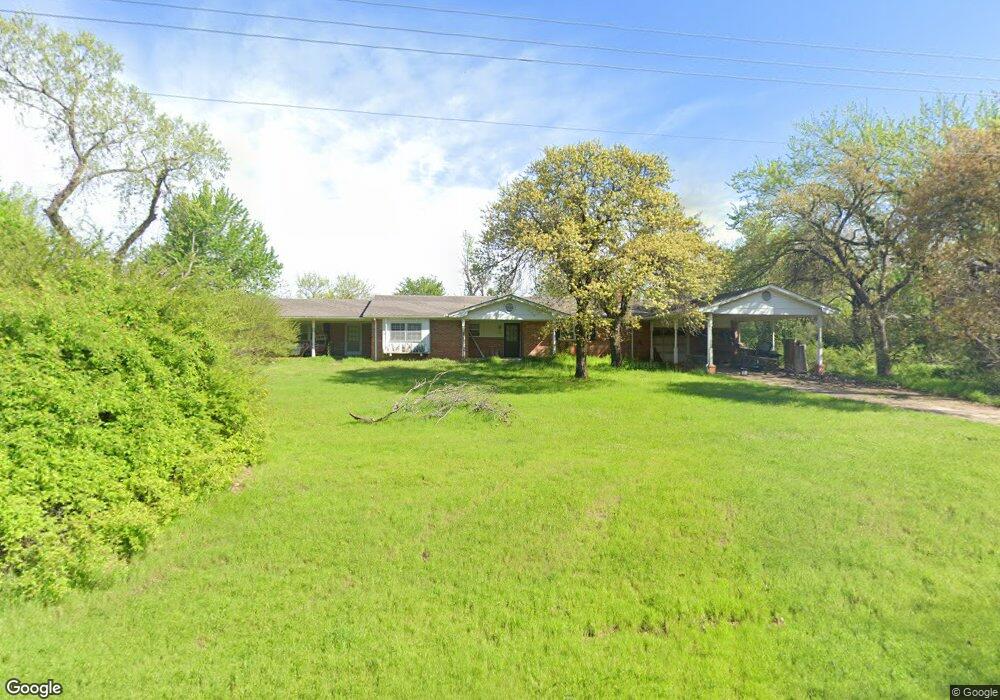
1205 Lenrose Ln Edmond, OK 73034
North Edmond NeighborhoodEstimated Value: $292,000 - $325,000
3
Beds
2
Baths
1,679
Sq Ft
$184/Sq Ft
Est. Value
About This Home
This home is located at 1205 Lenrose Ln, Edmond, OK 73034 and is currently estimated at $308,293, approximately $183 per square foot. 1205 Lenrose Ln is a home located in Oklahoma County with nearby schools including John Ross Elementary School, Sequoyah Middle School, and North High School.
Ownership History
Date
Name
Owned For
Owner Type
Purchase Details
Closed on
Feb 28, 2025
Sold by
Vanparsons Matthew and Tapper-Parsons Elizabeth Catherine
Bought by
Wooster Carson and Wooster Tiffany
Current Estimated Value
Purchase Details
Closed on
Jul 26, 2022
Sold by
Tapper Parsons and Tapper Beth
Bought by
Vanparsons Matthew and Tapper-Parsons Elizabeth Catherine
Home Financials for this Owner
Home Financials are based on the most recent Mortgage that was taken out on this home.
Original Mortgage
$205,000
Interest Rate
4.83%
Mortgage Type
New Conventional
Purchase Details
Closed on
Jul 1, 2022
Sold by
Tapper Don D
Bought by
Parsons Matt and Parsons Beth Tapper
Home Financials for this Owner
Home Financials are based on the most recent Mortgage that was taken out on this home.
Original Mortgage
$205,000
Interest Rate
4.83%
Mortgage Type
New Conventional
Create a Home Valuation Report for This Property
The Home Valuation Report is an in-depth analysis detailing your home's value as well as a comparison with similar homes in the area
Home Values in the Area
Average Home Value in this Area
Purchase History
| Date | Buyer | Sale Price | Title Company |
|---|---|---|---|
| Wooster Carson | $300,000 | Stewart-Ok City | |
| Wooster Carson | $300,000 | Stewart-Ok City | |
| Vanparsons Matthew | -- | Oklahoma City Abstract | |
| Parsons Matt | -- | Oklahoma City Abstract |
Source: Public Records
Mortgage History
| Date | Status | Borrower | Loan Amount |
|---|---|---|---|
| Previous Owner | Vanparsons Matthew | $205,000 |
Source: Public Records
Tax History
| Year | Tax Paid | Tax Assessment Tax Assessment Total Assessment is a certain percentage of the fair market value that is determined by local assessors to be the total taxable value of land and additions on the property. | Land | Improvement |
|---|---|---|---|---|
| 2025 | $3,146 | $31,447 | $2,183 | $29,264 |
| 2024 | $2,973 | $29,949 | $2,312 | $27,637 |
| 2023 | $2,973 | $28,523 | $2,070 | $26,453 |
| 2022 | $2,843 | $27,165 | $2,348 | $24,817 |
| 2021 | $2,695 | $25,872 | $2,493 | $23,379 |
| 2020 | $2,597 | $24,640 | $2,538 | $22,102 |
| 2019 | $2,532 | $23,908 | $2,425 | $21,483 |
| 2018 | $2,426 | $22,770 | $0 | $0 |
| 2017 | $2,397 | $22,604 | $2,538 | $20,066 |
| 2016 | $2,293 | $21,669 | $3,125 | $18,544 |
| 2015 | $2,201 | $20,821 | $3,113 | $17,708 |
| 2014 | $2,093 | $19,830 | $3,099 | $16,731 |
Source: Public Records
Map
Nearby Homes
- 1500 Coyote Trail
- 3740 Redmont Trace
- 2616 Redvine Rd
- 3100 Fountain Creek Dr
- 4108 Frisco Bridge Blvd
- 3032 Fountain Creek Dr
- 3024 Fountain Creek Dr
- 1433 Bay Bridge Ct
- 2304 N Brookdale Ave
- 2932 Sandstone Ridge
- 2301 Brookside Ave
- 1456 Narrows Bridge Cir
- 3224 Hidden Creek Dr
- 1401 Narrows Bridge Cir
- 0 Boulevard
- 2008 Brookwood Place
- 1108 Salvo Bridge Ct
- 1204 Brookhaven Dr
- 2833 Stonebrook Rd
- 1109 Salvo Bridge Ct
Your Personal Tour Guide
Ask me questions while you tour the home.