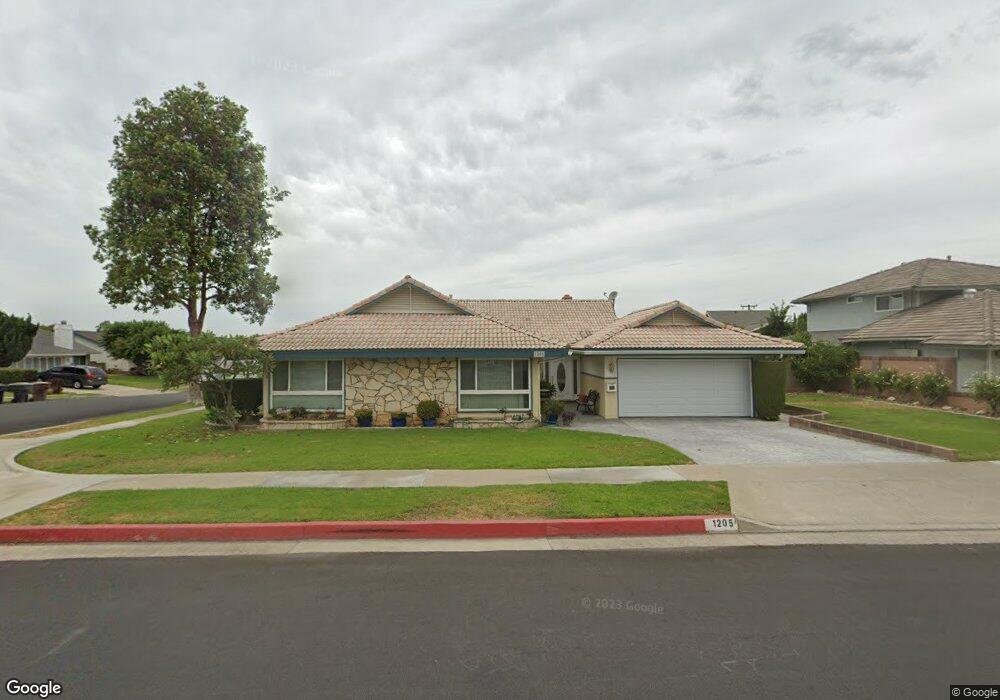
1205 N Jefferson St Placentia, CA 92870
Estimated Value: $1,115,545 - $1,210,000
4
Beds
2
Baths
2,018
Sq Ft
$582/Sq Ft
Est. Value
About This Home
This home is located at 1205 N Jefferson St, Placentia, CA 92870 and is currently estimated at $1,175,386, approximately $582 per square foot. 1205 N Jefferson St is a home located in Orange County with nearby schools including Van Buren Elementary School, Kraemer Middle School, and Valencia High School.
Ownership History
Date
Name
Owned For
Owner Type
Purchase Details
Closed on
Feb 20, 2020
Sold by
Ruppert Loretta and 2008 Foster
Bought by
Ruppert Loretta
Current Estimated Value
Home Financials for this Owner
Home Financials are based on the most recent Mortgage that was taken out on this home.
Original Mortgage
$250,000
Interest Rate
3.6%
Mortgage Type
New Conventional
Purchase Details
Closed on
Apr 24, 2014
Sold by
Ruppert Foster J and Ruppert Loretta F
Bought by
2008 Foster & Loretta Ruppert Revocable
Purchase Details
Closed on
Oct 18, 2010
Sold by
Ruppert Foster and Ruppert Loretta
Bought by
Ruppert Foster J and Ruppert Loretta F
Home Financials for this Owner
Home Financials are based on the most recent Mortgage that was taken out on this home.
Original Mortgage
$300,000
Interest Rate
4.31%
Mortgage Type
New Conventional
Purchase Details
Closed on
Jan 22, 2008
Sold by
Ruppert Foster J
Bought by
Ruppert Foster and Ruppert Loretta
Create a Home Valuation Report for This Property
The Home Valuation Report is an in-depth analysis detailing your home's value as well as a comparison with similar homes in the area
Home Values in the Area
Average Home Value in this Area
Purchase History
| Date | Buyer | Sale Price | Title Company |
|---|---|---|---|
| Ruppert Loretta | -- | Amrock Inc | |
| 2008 Foster & Loretta Ruppert Revocable | -- | None Available | |
| Ruppert Foster J | -- | Lsi | |
| Ruppert Foster | -- | None Available |
Source: Public Records
Mortgage History
| Date | Status | Borrower | Loan Amount |
|---|---|---|---|
| Closed | Ruppert Loretta | $250,000 | |
| Closed | Ruppert Foster J | $300,000 |
Source: Public Records
Tax History Compared to Growth
Tax History
| Year | Tax Paid | Tax Assessment Tax Assessment Total Assessment is a certain percentage of the fair market value that is determined by local assessors to be the total taxable value of land and additions on the property. | Land | Improvement |
|---|---|---|---|---|
| 2025 | $1,939 | $87,295 | $25,538 | $61,757 |
| 2024 | $1,939 | $85,584 | $25,037 | $60,547 |
| 2023 | $1,860 | $83,906 | $24,546 | $59,360 |
| 2022 | $1,704 | $82,261 | $24,064 | $58,197 |
| 2021 | $1,618 | $80,649 | $23,593 | $57,056 |
| 2020 | $1,506 | $79,823 | $23,352 | $56,471 |
| 2019 | $1,432 | $78,258 | $22,894 | $55,364 |
| 2018 | $1,408 | $76,724 | $22,445 | $54,279 |
| 2017 | $1,380 | $75,220 | $22,005 | $53,215 |
| 2016 | $1,353 | $73,746 | $21,574 | $52,172 |
| 2015 | $1,331 | $72,639 | $21,250 | $51,389 |
| 2014 | $1,300 | $71,217 | $20,834 | $50,383 |
Source: Public Records
Map
Nearby Homes
- 1261 Desoto St
- 17001 La Kenice Way
- 732 Olivier Dr
- 727 Olivier Dr
- 726 Olivier Dr
- 718 Olivier Dr
- 714 Olivier Dr
- 707 Olivier Dr
- 653 Patten Ave
- 1429 Prospect Ave Unit B
- 625 Patten Ave
- 582 Mcfadden St
- 4942 Gem Ln
- 1551 E Ray Dr
- 1000 Henrietta Cir
- Elina Plan at Vista Rose
- Lyda Plan at Vista Rose
- Prairie Plan at Vista Rose
- Gallica Plan at Vista Rose
- 5130 Webb Place
- 1349 Vina Del Mar Cir
- 1211 N Jefferson St
- 1343 Vina Del Mar Cir
- 1208 N Jefferson St
- 1356 Vina Del Mar Ave
- 1356 Omaha Ave
- 1214 N Jefferson St
- 1350 Vina Del Mar Ave
- 1350 Omaha Ave
- 1344 Vina Del Mar Ave
- 1344 Omaha Ave
- 1402 Carlsbad St
- 1339 Vina Del Mar Cir
- 1220 N Jefferson St
- 1403 Carlsbad St
- 1335 Vina Del Mar Cir
- 1338 Omaha Ave
- 1338 Vina Del Mar Ave
- 16991 Cumberland Cir
- 16981 Cumberland Cir