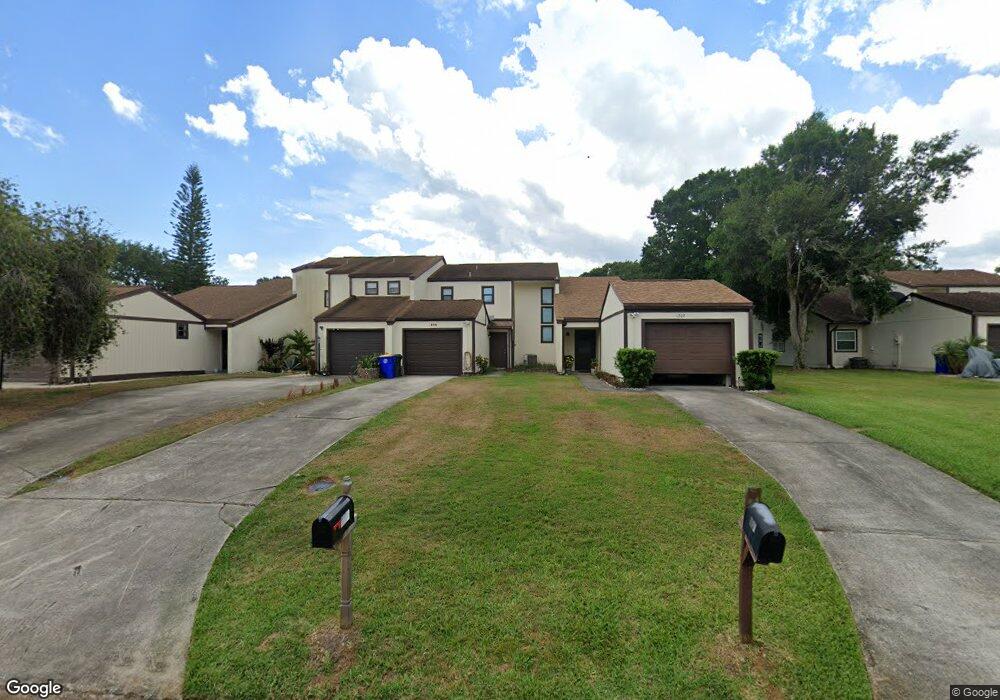
1205 Saint Andrews Dr Rockledge, FL 32955
Estimated Value: $185,000 - $251,000
2
Beds
3
Baths
1,353
Sq Ft
$164/Sq Ft
Est. Value
About This Home
This home is located at 1205 Saint Andrews Dr, Rockledge, FL 32955 and is currently estimated at $221,948, approximately $164 per square foot. 1205 Saint Andrews Dr is a home located in Brevard County with nearby schools including Golfview Elementary School, John F. Kennedy Middle School, and Rockledge Senior High School.
Ownership History
Date
Name
Owned For
Owner Type
Purchase Details
Closed on
Aug 6, 2009
Sold by
Morequity Inc
Bought by
Hunter Randy J and Hunter Kimberly A
Current Estimated Value
Purchase Details
Closed on
May 27, 2009
Sold by
Mcguiness David James and Mortgage Electronic Registrati
Bought by
Morequity Inc
Purchase Details
Closed on
Dec 30, 2002
Sold by
Schisler Kimberly Ann and Hunter Kimberly Ann
Bought by
Mcguiness David James
Home Financials for this Owner
Home Financials are based on the most recent Mortgage that was taken out on this home.
Original Mortgage
$87,000
Interest Rate
5.92%
Purchase Details
Closed on
Aug 19, 1993
Sold by
Goff Virginia Sizemore and Goff Roland W
Bought by
Schisler Kimberly Ann
Home Financials for this Owner
Home Financials are based on the most recent Mortgage that was taken out on this home.
Original Mortgage
$59,350
Interest Rate
7.22%
Create a Home Valuation Report for This Property
The Home Valuation Report is an in-depth analysis detailing your home's value as well as a comparison with similar homes in the area
Home Values in the Area
Average Home Value in this Area
Purchase History
| Date | Buyer | Sale Price | Title Company |
|---|---|---|---|
| Hunter Randy J | $55,000 | Albertelli Title Inc | |
| Morequity Inc | -- | Attorney | |
| Mcguiness David James | $87,000 | -- | |
| Schisler Kimberly Ann | $62,500 | -- |
Source: Public Records
Mortgage History
| Date | Status | Borrower | Loan Amount |
|---|---|---|---|
| Previous Owner | Mcguiness David James | $87,000 | |
| Previous Owner | Schisler Kimberly Ann | $59,350 |
Source: Public Records
Tax History Compared to Growth
Tax History
| Year | Tax Paid | Tax Assessment Tax Assessment Total Assessment is a certain percentage of the fair market value that is determined by local assessors to be the total taxable value of land and additions on the property. | Land | Improvement |
|---|---|---|---|---|
| 2025 | $2,564 | $184,260 | -- | -- |
| 2024 | $2,519 | $187,350 | -- | -- |
| 2023 | $2,519 | $190,430 | $0 | $0 |
| 2022 | $2,016 | $138,020 | $0 | $0 |
| 2021 | $1,855 | $110,950 | $32,000 | $78,950 |
| 2020 | $1,767 | $108,240 | $32,000 | $76,240 |
| 2019 | $1,698 | $106,350 | $32,000 | $74,350 |
| 2018 | $1,490 | $80,870 | $16,000 | $64,870 |
| 2017 | $1,384 | $70,640 | $16,000 | $54,640 |
| 2016 | $1,381 | $68,050 | $16,000 | $52,050 |
| 2015 | $1,359 | $64,950 | $16,000 | $48,950 |
| 2014 | $1,255 | $59,230 | $16,000 | $43,230 |
Source: Public Records
Map
Nearby Homes
- 1221 Saint Andrews Dr
- 1107 Woodlawn Rd
- 1428 Gleneagles Way
- 1292 Saint Andrews Dr
- 1303 Georgia Ave
- 1387 Gleneagles Ct
- 1355 Gleneagles Way
- 1400 Hoy Lake Ct
- 1122 Manatee Dr
- 980 Miracle Way
- 1131 Tarpon Dr
- 1044 Pompano Dr
- 1675 S Fiske Blvd Unit 156
- 1675 S Fiske Blvd Unit 218e
- 1376 Estridge Dr
- 1009 S Fiske Blvd
- 0 Barton Blvd E Unit 23200182
- 1600 Woodland Dr Unit 4105
- 1600 Woodland Dr Unit 4205
- 1600 Woodland Dr Unit 8209
- 1201 Saint Andrews Dr
- 1209 Saint Andrews Dr
- 1197 Saint Andrews Dr
- 1217 Saint Andrews Dr
- 1189 Saint Andrews Dr
- 1185 Saint Andrews Dr
- 1225 St Andrews Dr
- 1225 Saint Andrews Dr
- 1181 Saint Andrews Dr
- 1233 Saint Andrews Dr
- 1173 Saint Andrews Dr
- 1237 Saint Andrews Dr
- 1169 Saint Andrews Dr
- 1241 Saint Andrews Dr
- 1241 Saint Andrews Dr
- 1245 Saint Andrews Dr
- 1165 Saint Andrews Dr
- 1256 Saint Andrews Dr
- 1253 Saint Andrews Dr
- 1330 Naples Cir