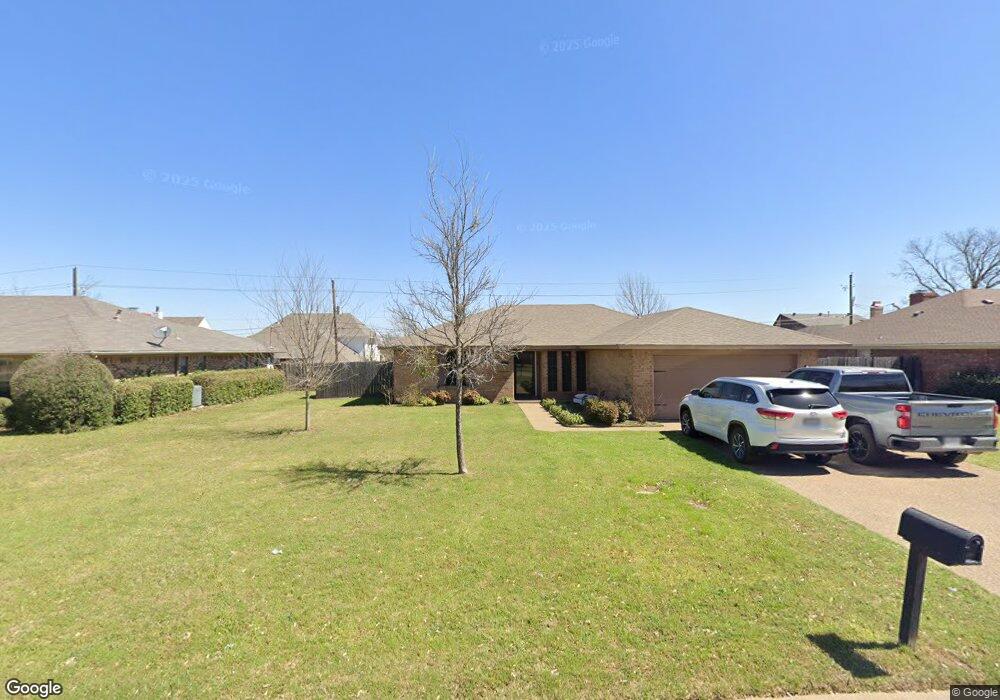
1205 Stonelake Dr Cleburne, TX 76033
Osage-North Fisk NeighborhoodEstimated Value: $271,446 - $294,000
3
Beds
2
Baths
1,697
Sq Ft
$168/Sq Ft
Est. Value
About This Home
This home is located at 1205 Stonelake Dr, Cleburne, TX 76033 and is currently estimated at $285,862, approximately $168 per square foot. 1205 Stonelake Dr is a home located in Johnson County with nearby schools including Gerard Elementary School, Lowell Smith Jr. Middle School, and Cleburne High School.
Ownership History
Date
Name
Owned For
Owner Type
Purchase Details
Closed on
Dec 15, 2010
Sold by
Kelley Marty and Kelley Kendra R
Bought by
White Tracy
Current Estimated Value
Home Financials for this Owner
Home Financials are based on the most recent Mortgage that was taken out on this home.
Original Mortgage
$100,000
Outstanding Balance
$66,135
Interest Rate
4.24%
Mortgage Type
New Conventional
Estimated Equity
$219,727
Purchase Details
Closed on
Sep 8, 2009
Sold by
Flagstar Bank Fsb
Bought by
The Secretary Of Housing & Urban Develop
Purchase Details
Closed on
Sep 1, 2009
Sold by
Lawrence Terry D
Bought by
Flagstar Bank Fsb
Purchase Details
Closed on
Sep 15, 2006
Sold by
Parle Darin and Parle Melissa
Bought by
Lawrence Terry D
Home Financials for this Owner
Home Financials are based on the most recent Mortgage that was taken out on this home.
Original Mortgage
$120,944
Interest Rate
6.55%
Mortgage Type
FHA
Create a Home Valuation Report for This Property
The Home Valuation Report is an in-depth analysis detailing your home's value as well as a comparison with similar homes in the area
Home Values in the Area
Average Home Value in this Area
Purchase History
| Date | Buyer | Sale Price | Title Company |
|---|---|---|---|
| White Tracy | -- | Stnt | |
| The Secretary Of Housing & Urban Develop | -- | None Available | |
| Flagstar Bank Fsb | $125,854 | None Available | |
| Lawrence Terry D | -- | Fatco |
Source: Public Records
Mortgage History
| Date | Status | Borrower | Loan Amount |
|---|---|---|---|
| Open | White Tracy | $100,000 | |
| Previous Owner | Lawrence Terry D | $120,944 |
Source: Public Records
Tax History Compared to Growth
Tax History
| Year | Tax Paid | Tax Assessment Tax Assessment Total Assessment is a certain percentage of the fair market value that is determined by local assessors to be the total taxable value of land and additions on the property. | Land | Improvement |
|---|---|---|---|---|
| 2025 | $4,160 | $285,698 | $61,500 | $224,198 |
| 2024 | $5,570 | $249,811 | $0 | $0 |
| 2023 | $3,680 | $285,698 | $61,500 | $224,198 |
| 2022 | $5,167 | $224,154 | $49,000 | $175,154 |
| 2021 | $4,897 | $193,038 | $41,500 | $151,538 |
| 2020 | $4,728 | $170,624 | $28,000 | $142,624 |
| 2019 | $4,922 | $170,624 | $28,000 | $142,624 |
| 2018 | $4,476 | $158,149 | $28,000 | $130,149 |
| 2017 | $4,052 | $142,345 | $28,000 | $114,345 |
| 2016 | $3,684 | $125,144 | $28,000 | $97,144 |
| 2015 | $2,880 | $122,863 | $28,000 | $94,863 |
| 2014 | $2,880 | $120,345 | $28,000 | $92,345 |
Source: Public Records
Map
Nearby Homes
- 1209 Stonelake Dr
- 1105 Hemphill Ct
- 1327 Hemphill Dr
- 1602 Murry Dr
- 1307 Bradley Ct
- 1304 Bradley Ct
- 1302 Cindy Ct
- 1223 Country Club Rd
- 1617 Hawthorne St
- 1208 Cindy Ln
- 1201 Sausalito Trail
- 1211 Greenbriar Ln
- 1217 Sausalito Trail
- 806 S Colonial Dr
- 840 S Ridgeway Dr
- 1106 Tiburon Trail
- 1307 Lynnwood Dr
- 1114 Tiburon Trail
- 1210 Tiburon Trail
- 906 Chestnut Grove Dr
- 1207 Stonelake Dr
- 1203 Stonelake Dr
- 1106 Janehaven Lakes
- 1201 Stonelake Dr
- 1204 Stonelake Dr
- 1104 Janehaven Lakes
- 1202 Stonelake Dr
- 1110 Janehaven Lakes
- 1102 Janehaven Lakes
- 1115 Stonelake Dr
- 1211 Stonelake Dr
- 1210 Stonelake Dr
- 1112 Janehaven Lakes
- 1502 Lindsey Ln W
- 1100 Janehaven Lakes
- 1503 Cindy Ln
- 1500 Cindy Ln
- 1113 Stonelake Dr
- 1213 Stonelake Dr
- 1212 Stonelake Dr