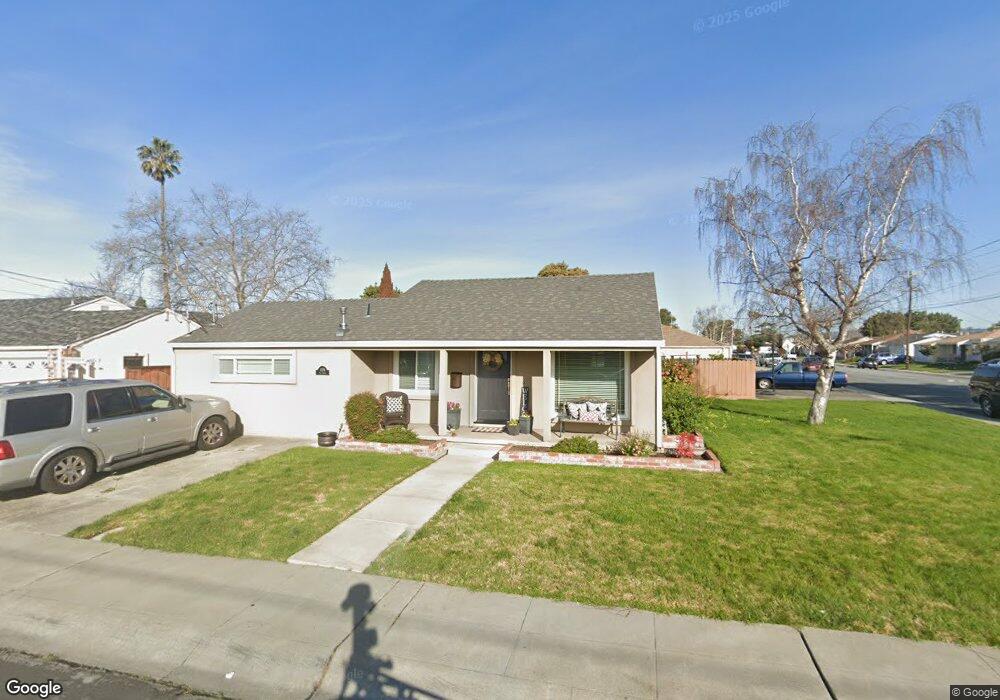
1205 Via Lucas San Lorenzo, CA 94580
Estimated Value: $818,551 - $909,000
3
Beds
1
Bath
1,411
Sq Ft
$610/Sq Ft
Est. Value
About This Home
This home is located at 1205 Via Lucas, San Lorenzo, CA 94580 and is currently estimated at $860,138, approximately $609 per square foot. 1205 Via Lucas is a home located in Alameda County with nearby schools including Bay Elementary School, Bohannon Middle School, and Arroyo High School.
Ownership History
Date
Name
Owned For
Owner Type
Purchase Details
Closed on
Mar 24, 2011
Sold by
Da Rosa Alia
Bought by
Da Rosa Mario
Current Estimated Value
Home Financials for this Owner
Home Financials are based on the most recent Mortgage that was taken out on this home.
Original Mortgage
$290,173
Outstanding Balance
$194,231
Interest Rate
4.25%
Mortgage Type
FHA
Estimated Equity
$665,907
Purchase Details
Closed on
Dec 15, 2006
Sold by
Darosa Mario and Darosa Alia
Bought by
Darosa Mario and Darosa Alia
Home Financials for this Owner
Home Financials are based on the most recent Mortgage that was taken out on this home.
Original Mortgage
$200,000
Interest Rate
6.22%
Mortgage Type
New Conventional
Purchase Details
Closed on
Feb 8, 2000
Sold by
Reckas Frosene F and Reckas Constance
Bought by
Darosa Mario and Dominguez Alia
Home Financials for this Owner
Home Financials are based on the most recent Mortgage that was taken out on this home.
Original Mortgage
$160,000
Interest Rate
8.06%
Mortgage Type
Stand Alone First
Create a Home Valuation Report for This Property
The Home Valuation Report is an in-depth analysis detailing your home's value as well as a comparison with similar homes in the area
Home Values in the Area
Average Home Value in this Area
Purchase History
| Date | Buyer | Sale Price | Title Company |
|---|---|---|---|
| Da Rosa Mario | -- | First American Title Company | |
| Darosa Mario | -- | Alliance Title Company | |
| Darosa Mario | $200,000 | -- |
Source: Public Records
Mortgage History
| Date | Status | Borrower | Loan Amount |
|---|---|---|---|
| Open | Da Rosa Mario | $290,173 | |
| Closed | Darosa Mario | $200,000 | |
| Closed | Darosa Mario | $160,000 | |
| Closed | Darosa Mario | $19,999 |
Source: Public Records
Tax History Compared to Growth
Tax History
| Year | Tax Paid | Tax Assessment Tax Assessment Total Assessment is a certain percentage of the fair market value that is determined by local assessors to be the total taxable value of land and additions on the property. | Land | Improvement |
|---|---|---|---|---|
| 2025 | $4,292 | $300,377 | $92,213 | $215,164 |
| 2024 | $4,292 | $294,351 | $90,405 | $210,946 |
| 2023 | $4,281 | $295,443 | $88,633 | $206,810 |
| 2022 | $4,206 | $282,651 | $86,895 | $202,756 |
| 2021 | $4,085 | $276,973 | $85,192 | $198,781 |
| 2020 | $3,988 | $281,063 | $84,319 | $196,744 |
| 2019 | $3,982 | $275,553 | $82,666 | $192,887 |
| 2018 | $3,727 | $270,151 | $81,045 | $189,106 |
| 2017 | $3,559 | $264,855 | $79,456 | $185,399 |
| 2016 | $3,392 | $259,663 | $77,899 | $181,764 |
| 2015 | $3,316 | $255,763 | $76,729 | $179,034 |
| 2014 | $3,266 | $250,753 | $75,226 | $175,527 |
Source: Public Records
Map
Nearby Homes
- 1311 Via Manzanas
- 17069 Via Chiquita
- 16050 Via Olinda
- 1338 Via la Paloma
- 15967 Paseo Del Campo
- 1575 Via Lucas
- 1608 Keller Ave
- 16011 Via Conejo
- 0 E 14th St Unit 41059501
- 17316 Via Flores
- 17347 Via Encinas
- 17354 Via el Cerrito
- 1631 Via Ventana
- 1766 Via Redondo
- 1655 Via Escondido
- 17761 Via Arriba
- 18003 Incline Place
- 1867 Via Buena Vista
- 15867 Hesperian Blvd
- 18018 Sahara Rd
- 1219 Via Lucas
- 16175 Via Chiquita
- 1233 Via Lucas
- 16167 Via Chiquita
- 1179 Via Lucas
- 1202 Via Lucas
- 1216 Via Lucas
- 16190 Via Chiquita
- 1247 Via Lucas
- 16159 Via Chiquita
- 1286 Via San Juan
- 1270 Via San Juan
- 1186 Via Lucas
- 1230 Via Lucas
- 1153 Via Lucas
- 1170 Via Lucas
- 1261 Via Lucas
- 1244 Via Lucas
- 16151 Via Chiquita
- 16174 Via Chiquita