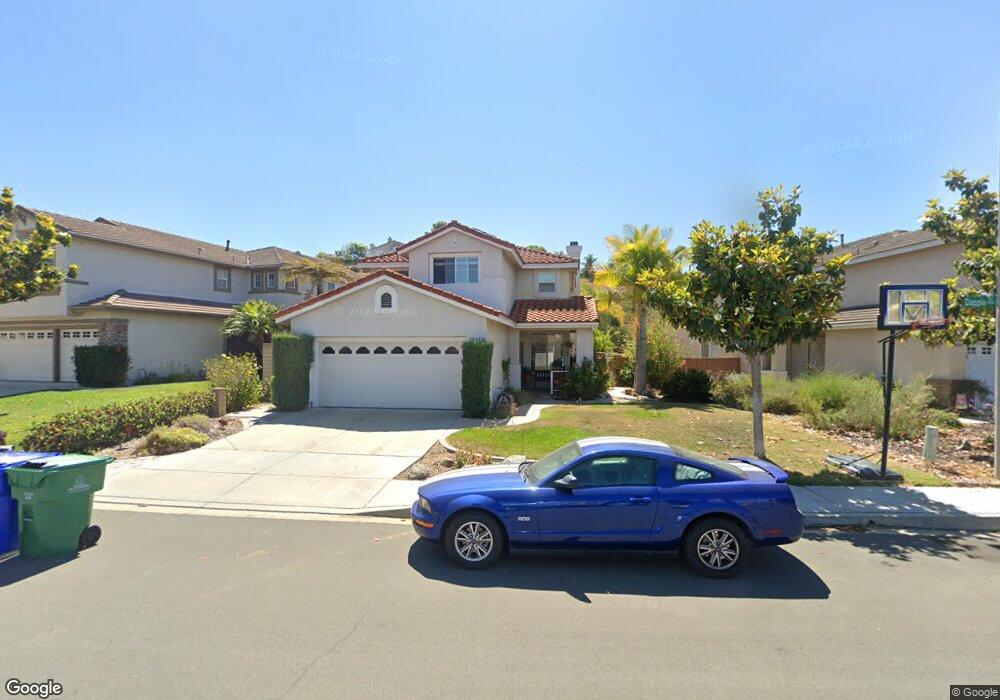
12053 Dapple Way San Diego, CA 92128
Estimated Value: $1,500,000 - $1,559,000
5
Beds
3
Baths
2,247
Sq Ft
$684/Sq Ft
Est. Value
About This Home
This home is located at 12053 Dapple Way, San Diego, CA 92128 and is currently estimated at $1,536,276, approximately $683 per square foot. 12053 Dapple Way is a home located in San Diego County with nearby schools including Creekside Elementary, Meadowbrook Middle, and Mt. Carmel High School.
Ownership History
Date
Name
Owned For
Owner Type
Purchase Details
Closed on
Dec 15, 2020
Sold by
Stinebaugh Jon H
Bought by
Stinebaugh Jon H and Jon Stinebaugh Family Trust
Current Estimated Value
Home Financials for this Owner
Home Financials are based on the most recent Mortgage that was taken out on this home.
Original Mortgage
$487,000
Outstanding Balance
$433,575
Interest Rate
2.7%
Mortgage Type
New Conventional
Estimated Equity
$1,102,701
Purchase Details
Closed on
Apr 9, 2020
Sold by
Stinebaugh John Jh
Bought by
Stinebaugh Jon H
Purchase Details
Closed on
Dec 26, 2019
Sold by
Stinebaugh Jon H and Stinebaugh Michelle D
Bought by
Stinebaugh Jon H
Home Financials for this Owner
Home Financials are based on the most recent Mortgage that was taken out on this home.
Original Mortgage
$484,350
Interest Rate
3.7%
Mortgage Type
New Conventional
Purchase Details
Closed on
Dec 24, 2013
Sold by
Stinebaugh Jon H
Bought by
Stinebaugh Jon H and Stinebaugh Michelle D
Home Financials for this Owner
Home Financials are based on the most recent Mortgage that was taken out on this home.
Original Mortgage
$480,000
Interest Rate
3.25%
Mortgage Type
Adjustable Rate Mortgage/ARM
Purchase Details
Closed on
Nov 1, 2013
Sold by
Stinebaugh Michelle D
Bought by
Stinebaugh Jon H
Home Financials for this Owner
Home Financials are based on the most recent Mortgage that was taken out on this home.
Original Mortgage
$480,000
Interest Rate
3.25%
Mortgage Type
Adjustable Rate Mortgage/ARM
Purchase Details
Closed on
Jan 4, 2000
Sold by
Arturo Servin
Bought by
Stinebaugh Jon H and Stinebaugh Michelle D
Home Financials for this Owner
Home Financials are based on the most recent Mortgage that was taken out on this home.
Original Mortgage
$271,200
Interest Rate
7.5%
Purchase Details
Closed on
Dec 18, 1998
Sold by
Arturo Servin and Arturo Aurora O
Bought by
Servin Arturo and Servin Aurora
Home Financials for this Owner
Home Financials are based on the most recent Mortgage that was taken out on this home.
Original Mortgage
$227,150
Interest Rate
6.91%
Purchase Details
Closed on
Dec 6, 1995
Sold by
Pardee Construction Company
Bought by
Servin Arturo and Servin Aurora O
Home Financials for this Owner
Home Financials are based on the most recent Mortgage that was taken out on this home.
Original Mortgage
$207,000
Interest Rate
7.37%
Create a Home Valuation Report for This Property
The Home Valuation Report is an in-depth analysis detailing your home's value as well as a comparison with similar homes in the area
Home Values in the Area
Average Home Value in this Area
Purchase History
| Date | Buyer | Sale Price | Title Company |
|---|---|---|---|
| Stinebaugh Jon H | -- | Accommodation | |
| Stinebaugh Jon H | -- | Chicago Title Company | |
| Stinebaugh Jon H | -- | None Available | |
| Stinebaugh Jon H | -- | Chicago Title Co Sd | |
| Stinebaugh Jon H | -- | None Available | |
| Stinebaugh Jon H | -- | First American Title Company | |
| Stinebaugh Jon H | $339,000 | Southland Title | |
| Servin Arturo | -- | Lawyers Title | |
| Servin Arturo | $220,000 | -- |
Source: Public Records
Mortgage History
| Date | Status | Borrower | Loan Amount |
|---|---|---|---|
| Open | Stinebaugh Jon H | $487,000 | |
| Closed | Stinebaugh Jon H | $484,350 | |
| Closed | Stinebaugh Jon H | $480,000 | |
| Closed | Stinebaugh Jon H | $271,200 | |
| Previous Owner | Servin Arturo | $227,150 | |
| Previous Owner | Servin Arturo | $207,000 | |
| Closed | Stinebaugh Jon H | $16,950 |
Source: Public Records
Tax History Compared to Growth
Tax History
| Year | Tax Paid | Tax Assessment Tax Assessment Total Assessment is a certain percentage of the fair market value that is determined by local assessors to be the total taxable value of land and additions on the property. | Land | Improvement |
|---|---|---|---|---|
| 2025 | $6,318 | $607,598 | $207,481 | $400,117 |
| 2024 | $6,318 | $595,685 | $203,413 | $392,272 |
| 2023 | $6,179 | $584,006 | $199,425 | $384,581 |
| 2022 | $6,084 | $572,556 | $195,515 | $377,041 |
| 2021 | $5,971 | $561,331 | $191,682 | $369,649 |
| 2020 | $5,907 | $555,576 | $189,717 | $365,859 |
| 2019 | $6,573 | $544,684 | $185,998 | $358,686 |
| 2018 | $6,397 | $534,004 | $182,351 | $351,653 |
| 2017 | $81 | $523,534 | $178,776 | $344,758 |
| 2016 | $6,156 | $513,270 | $175,271 | $337,999 |
| 2015 | $6,076 | $505,561 | $172,639 | $332,922 |
| 2014 | $6,001 | $495,659 | $169,258 | $326,401 |
Source: Public Records
Map
Nearby Homes
- 11770 Fantasia Ct
- 11553 Trailbrook Ln Unit 2
- 11954 Cypress Valley Dr
- 11495 Cypress Canyon Rd
- 12530 Heatherton Ct Unit 31
- 12490 Heatherton Ct Unit 8
- 10976 Caminito Alto
- 11393 Vista Elevada
- 12410 Aria Ct
- 10878 Caminito Colorado
- 12953 Carriage Rd
- 12450 Robison Blvd
- 10978 Serafina Ln
- 11129 Caminito Arcada Unit 256
- 10941 Waterton Rd
- 12918 Seiler St
- 12643 Robison Blvd Unit 213
- 11313 Wild Meadow Place
- 11148 Twinleaf Way
- 13047 Corona Way Unit 266
- 12057 Dapple Way Unit 6
- 12045 Dapple Way Unit 6
- 12065 Dapple Way
- 12041 Dapple Way Unit H
- 12071 Dapple Way
- 12037 Dapple Way Unit 6
- 12050 Dapple Way
- 12056 Dapple Way Unit 6
- 12062 Dapple Way
- 12046 Dapple Way
- 12079 Dapple Way
- 12031 Dapple Way
- 12042 Dapple Way
- 12068 Dapple Way
- 12083 Dapple Way
- 12038 Dapple Way
- 12030 Dapple Ct
- 12025 Dapple Way
- 12072 Dapple Way
- 12032 Dapple Way